Redemption Report
You can view the Redemption Report in Offers > Redemption Report. The Redemption Report is comprised of two tabs:
- Overview
- Deals Summary
Important Note: While the Overview tab is accessible by all users, the data being shown is dependent on which locations the user has access to. For example, a Franchisee owner who has access to only 10 out of 100 locations of the brand, will see the Redemption data only for those 10 locations. Additionally, the Deals Summary must be enabled by Punchh. Please contact your Punchh representative with questions.
Date Range Available
Data is made available for the last two years, not counting today. For example, if today is 2024-Jul-24, the data from 2022-Jul-24 to 2024-Jul-23 is made available in the report.
Why is there a discrepancy between the Segments data and the Redemption Report?
It's important to note that:
- The Redemption Report displays data from the past two years and includes all reward redemptions, including both loyalty unlock redeemable and campaign offers.
- Segments, on the other hand, contain lifetime data (or can be customized for a specific duration) but only reflect redemptions related to campaign offers or rewards.
Therefore, you might see a discrepancy between the segment's size (found on the segment's detail page) and the data in the Redemption Report.
Data Refresh Frequency
Data is reported from an aggregated source and refreshed daily once at 7 AM EST. However, it may vary, up to a maximum of 11 AM EST. This can be checked from the latest refresh data time stamp shown on the dashboard.
Overview
This tab displays both high-level redemption stats and granular redemption data for each unique redeemable.
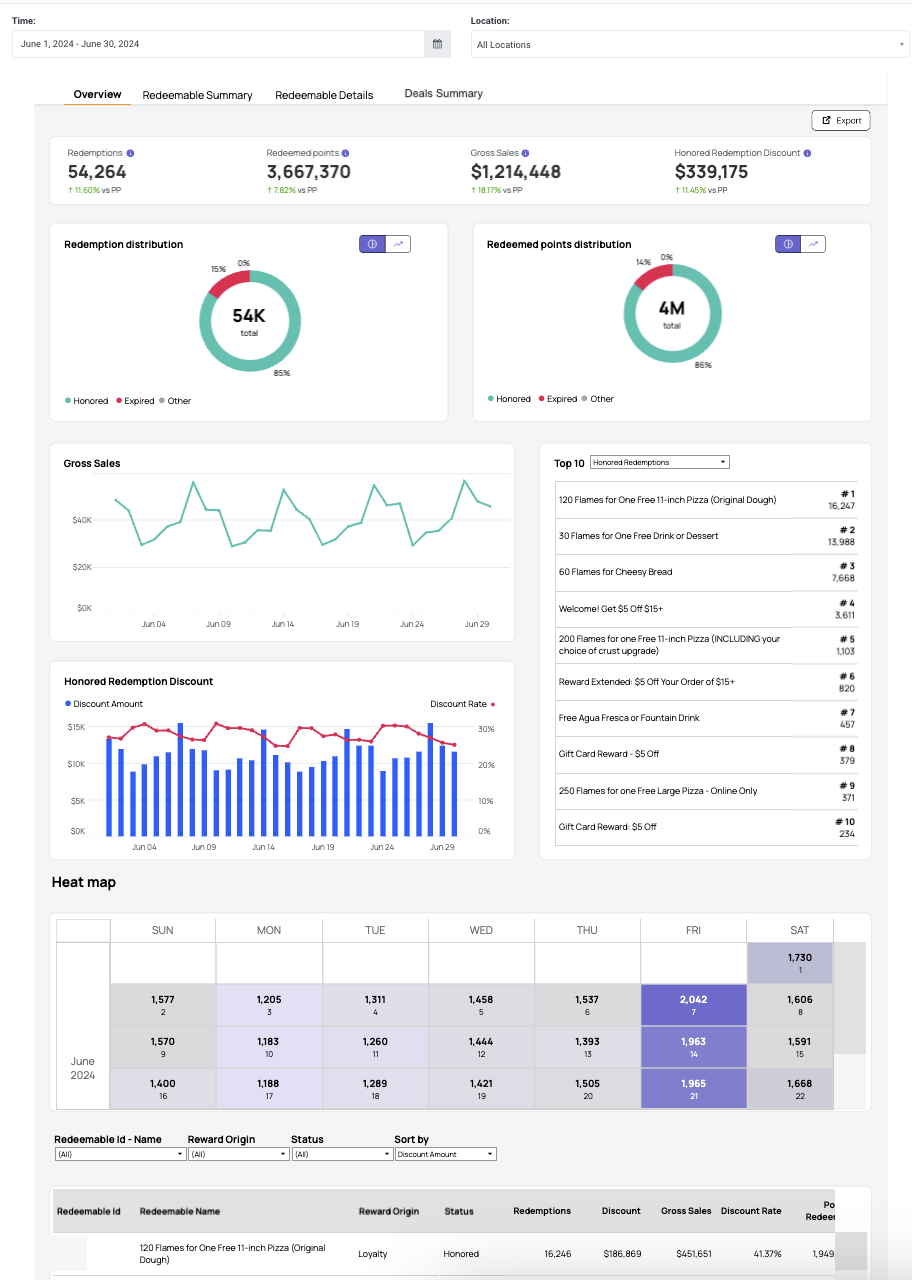
This report does not cover redemptions associated with Promo and Coupon campaigns that are configured with the option of "Directly Processed at POS". Therefore, the metrics on the Redemption Report may not match the metrics for Redemptions and Redemption Sales on the Dashboard (landing page). For more information on different redemption workflows, please refer to Understanding Punchh Data: Redemption Workflows.
Overall Metrics
The top section summarizes the report with four metrics and the respective comparison to the previous period.

| Report Metric | Definition |
|---|---|
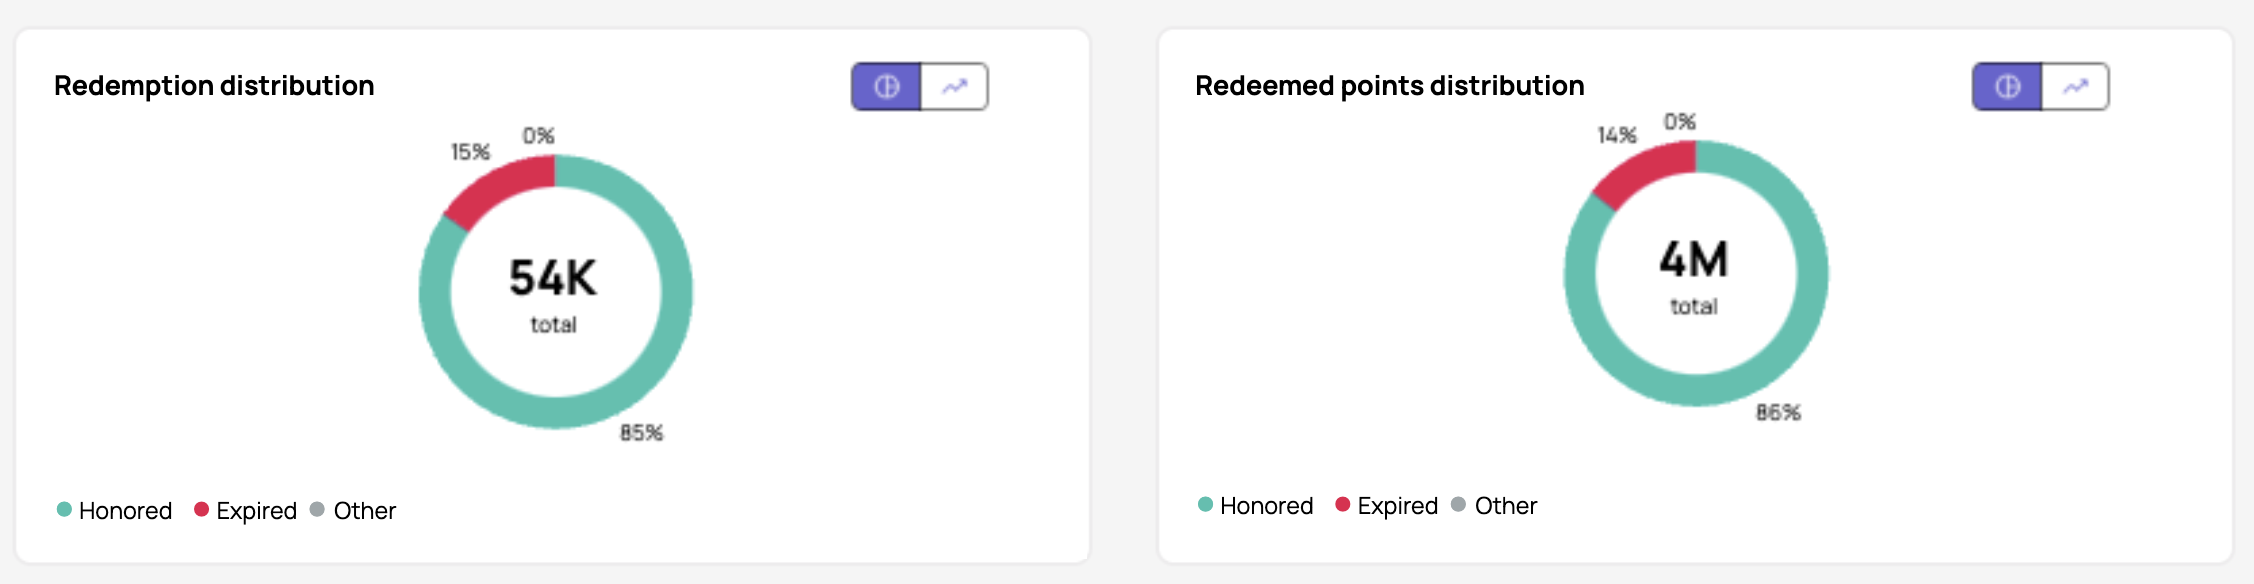
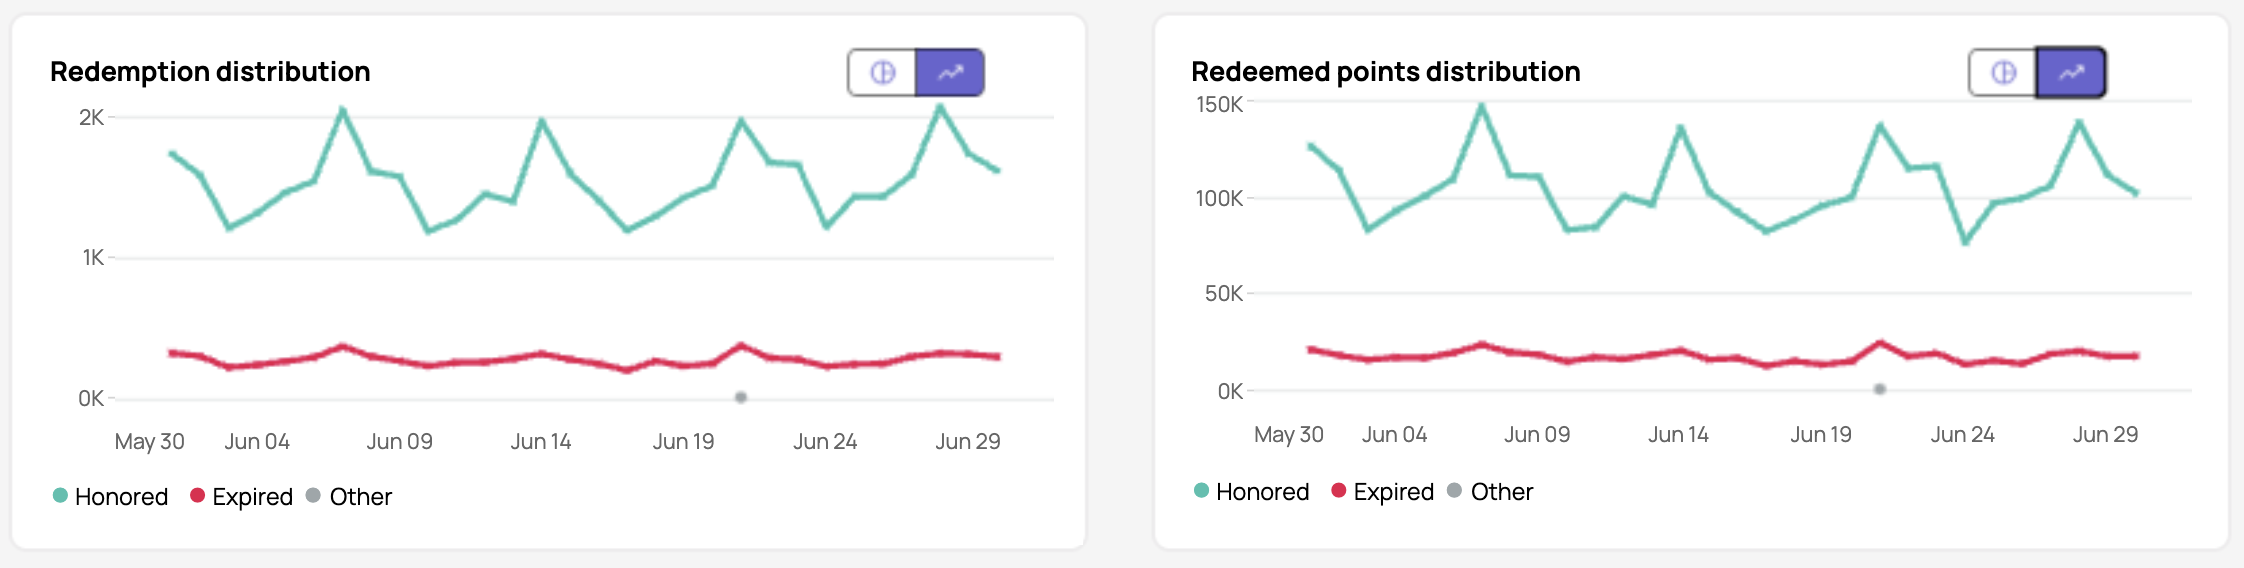
| Redemptions | Represents all redemption attempts, including successful, expired, etc. in a given time period. The successful redemptions (Honored Redemptions) are filtered based on the date-time stamp of the successful redemption in the business time zone. For unsuccessful/expired redemptions, the redemption attempt date-time stamp in the business time zone is used The colors in the pie chart and the different lines in the line chart denote the redemptions by their respective status (honored, expired, etc.) |
| Redeemed Points | Represents the total points redeemed as part of the redemption. Note that not all redemptions will have points associated with them. For example, some item-based offers sent as part of campaigns may not be associated with points at all. The colors in the pie chart and the different lines in the line chart denote the redeemed points associated with redemptions by their respective status (honored, expired, etc.) |
| Gross Sales | Represents the total gross sales associated with all the transactions of which successful redemptions were a part. |
| Honored Redemption Discount | Represents the total gross sales associated with all the transactions of which successful redemptions were a part. |
Redemption and Redeemed Points Distribution
This section shows the distribution of redemptions and redeemed points in the selected time frame and a toggle to choose between a pie chart and a line chart.
Gross Sales, Discount Distribution, and Top 10 Offers
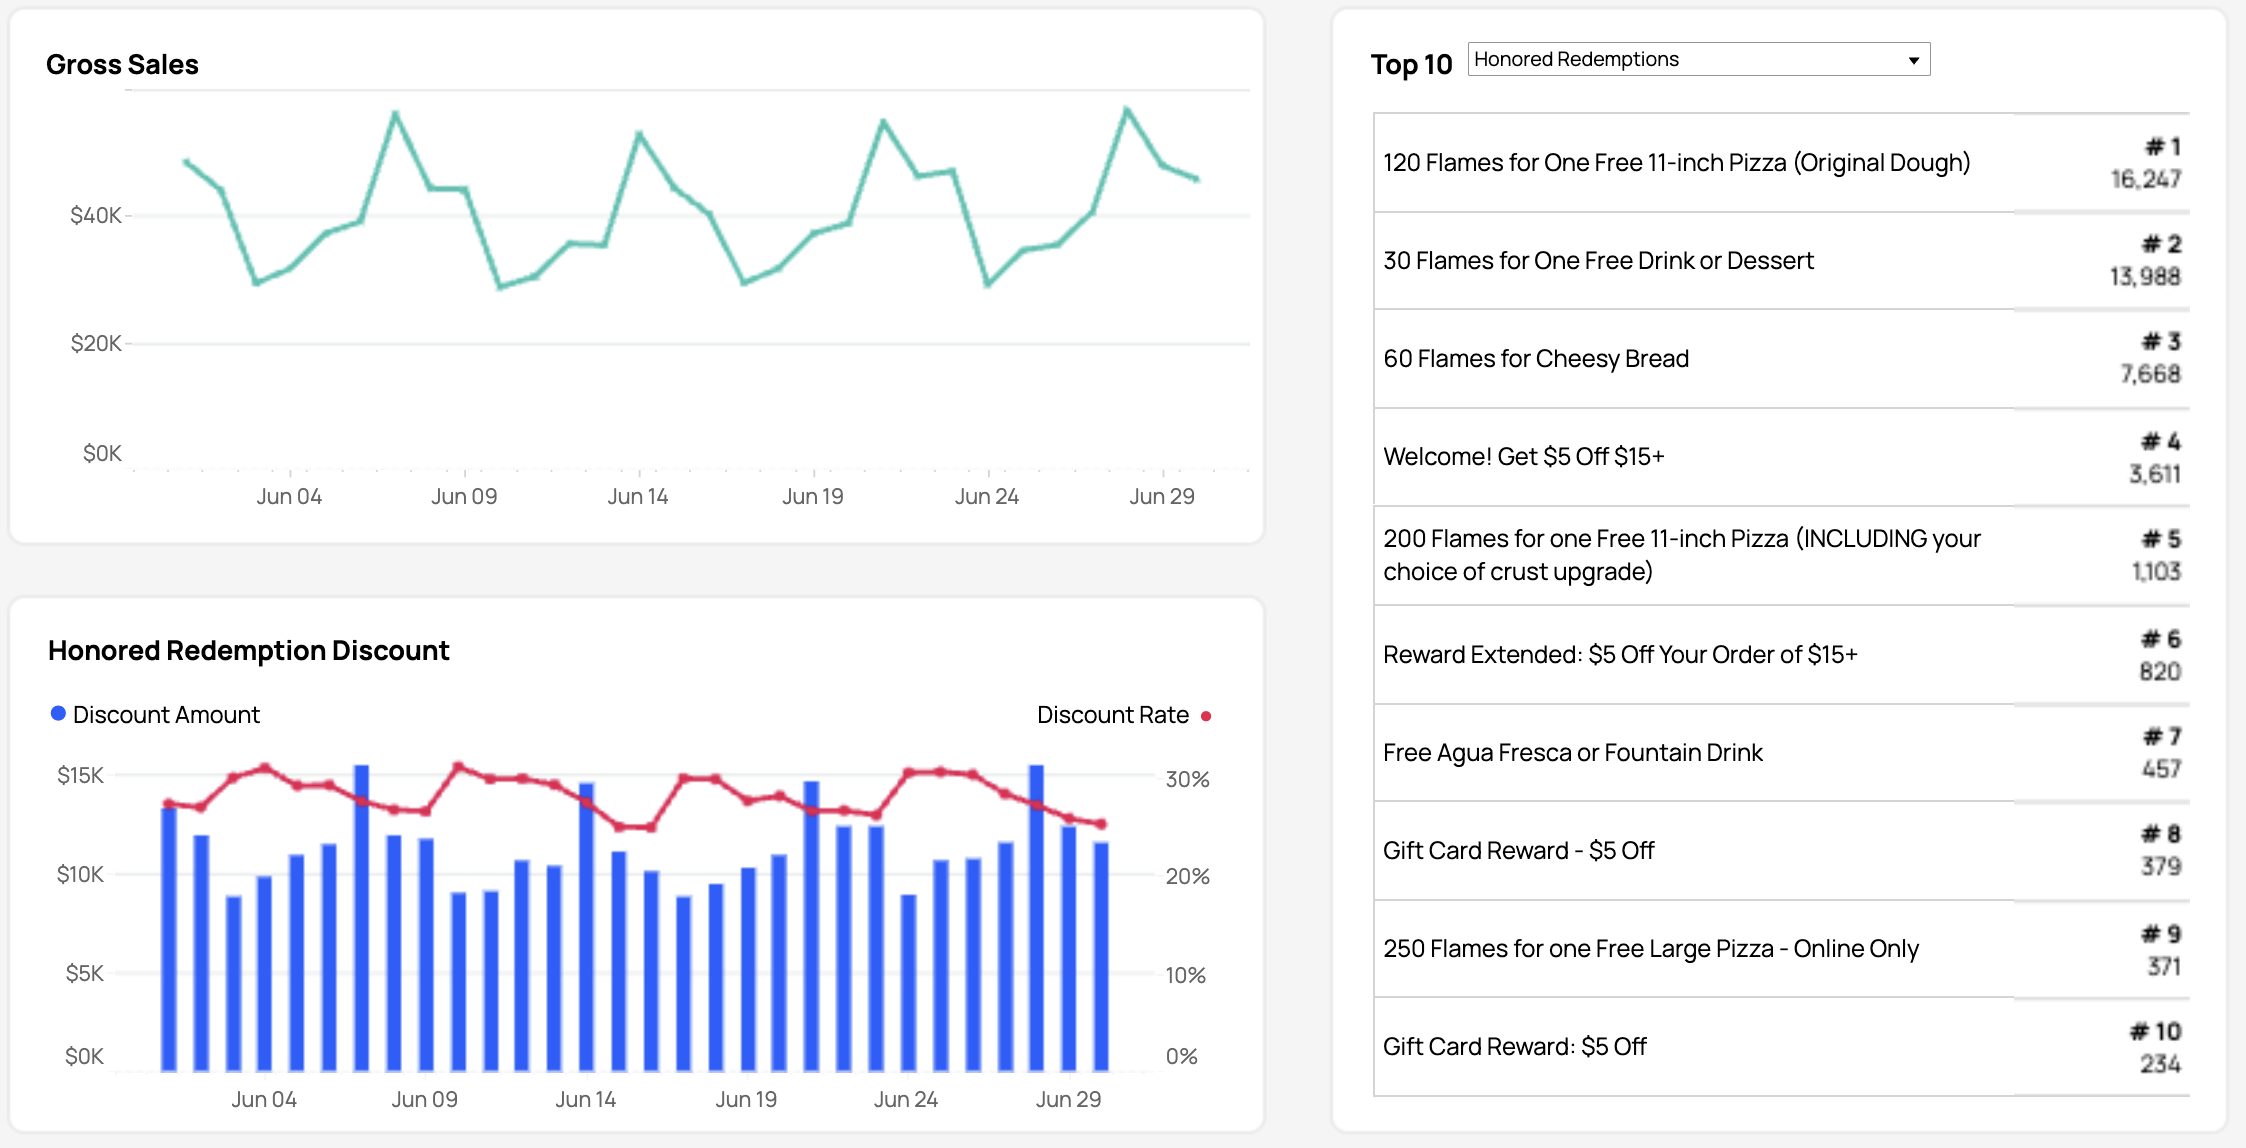
Gross Sales: Shows the distribution of gross sales.
Honored Redemption Discount: Shows the distribution of the discount amount (bar chart) and discount rate i.e. Honored Redemption Discount/Honored Redemption Gross Sales expressed as a percentage (line chart).
Top 10 Offers: Top 10 offers (redeemable) are shown based on the metrics selected from the drop-down menu i.e. Total Redemptions, Honored Redemptions, Honored Redemptions Discount, Honored Redemptions Gross Sales.
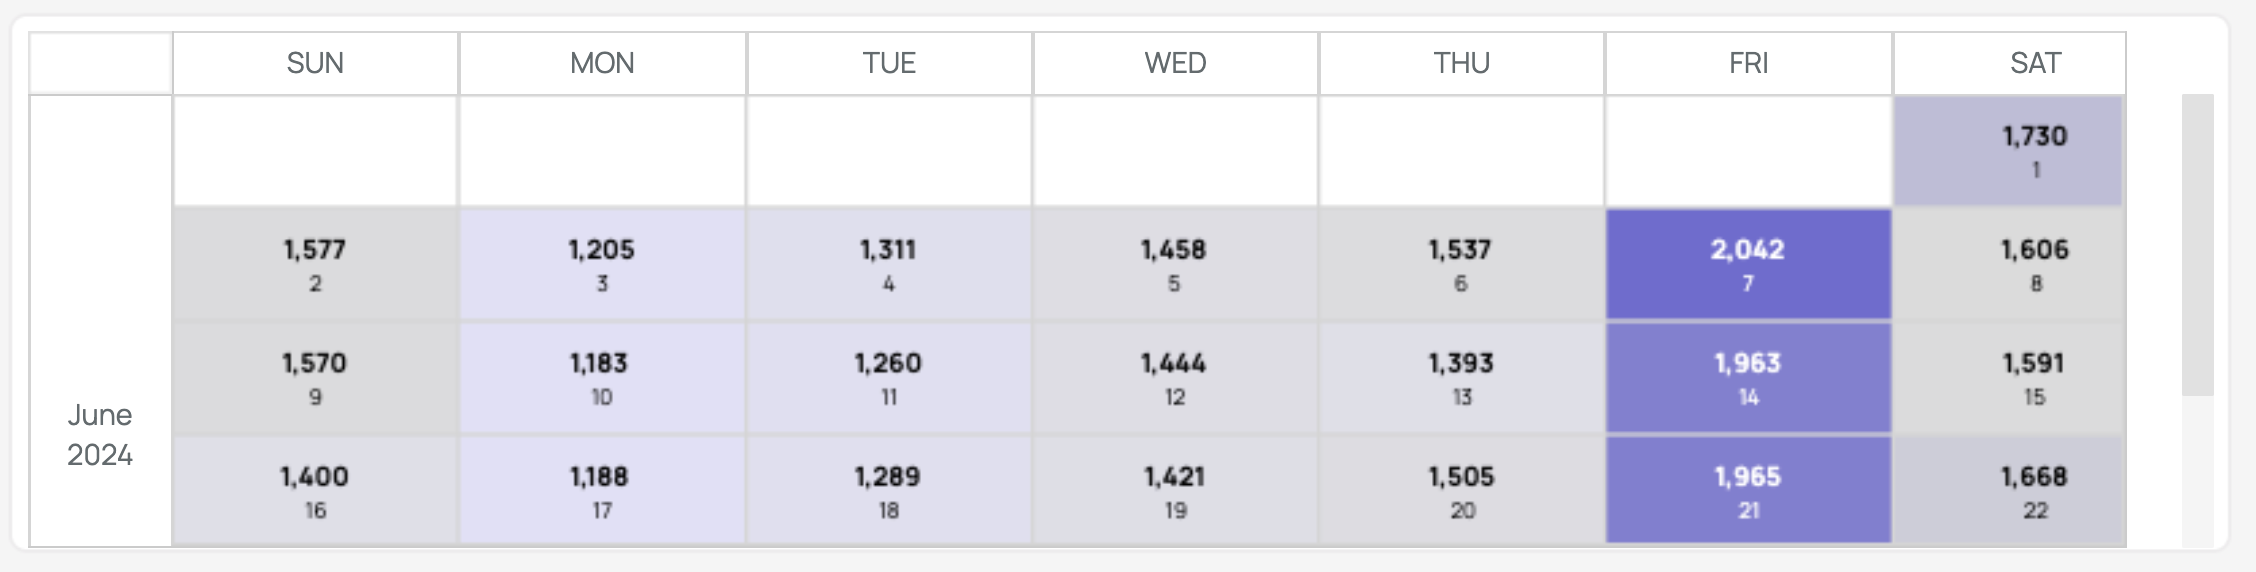
Heatmap
Based on the metric selected under Top 10, the Heatmap shows the data that selected metrics on a per-day basis.
Redeemable Performance List
This view shows the performance of each redeemable based on the date range and locations you select, with one row per redeemable, reward origin, and redemption status.
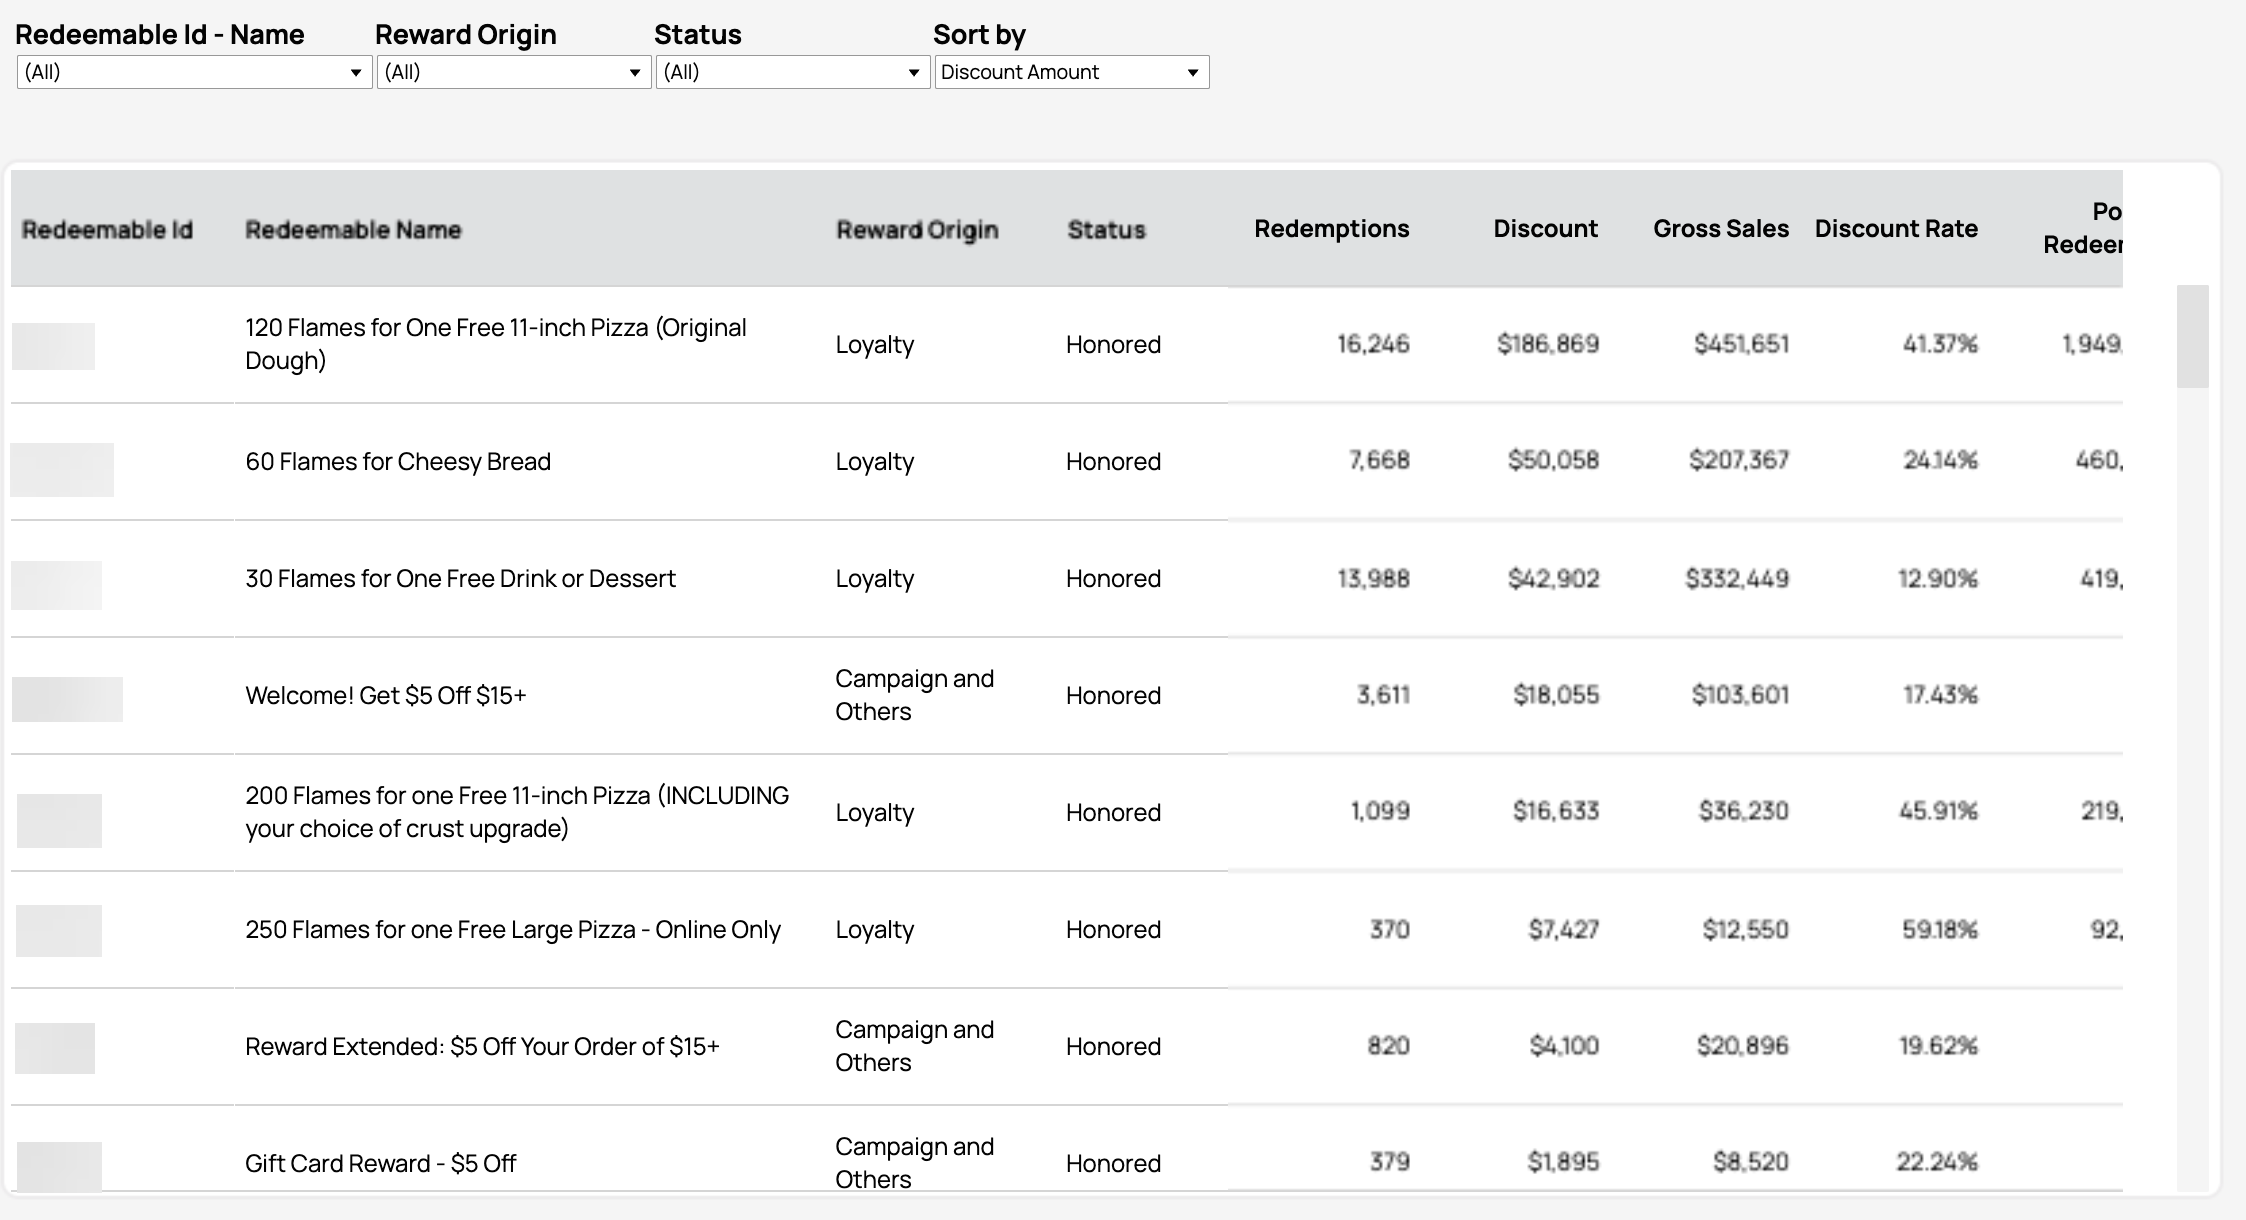
The following are the metrics shown for each redeemable:
| Redeemable Metric | Definition |
|---|---|
| Redeemable ID | The unique identifier of a Redeemable on Punchh |
| Redeemable Name | Name of the Redeemable |
| Reward Origin |
|
| Status | Represents the status of a redemption. Possible values include Honored, Expired, and Others (which include Staged or Unassigned Redemptions that weren’t successful) |
| Redemptions | Represents the count of redemptions for the given Redeemable ID, from a specific Reward Origin with a given status |
| Discount Amount |
|
| Gross Spend |
|
| Discount Rate |
|
| Redeemed Points |
|
Deals Summary
This tab displays both high-level redemption stats and granular redemption data for each unique redeemable specific to Deals.
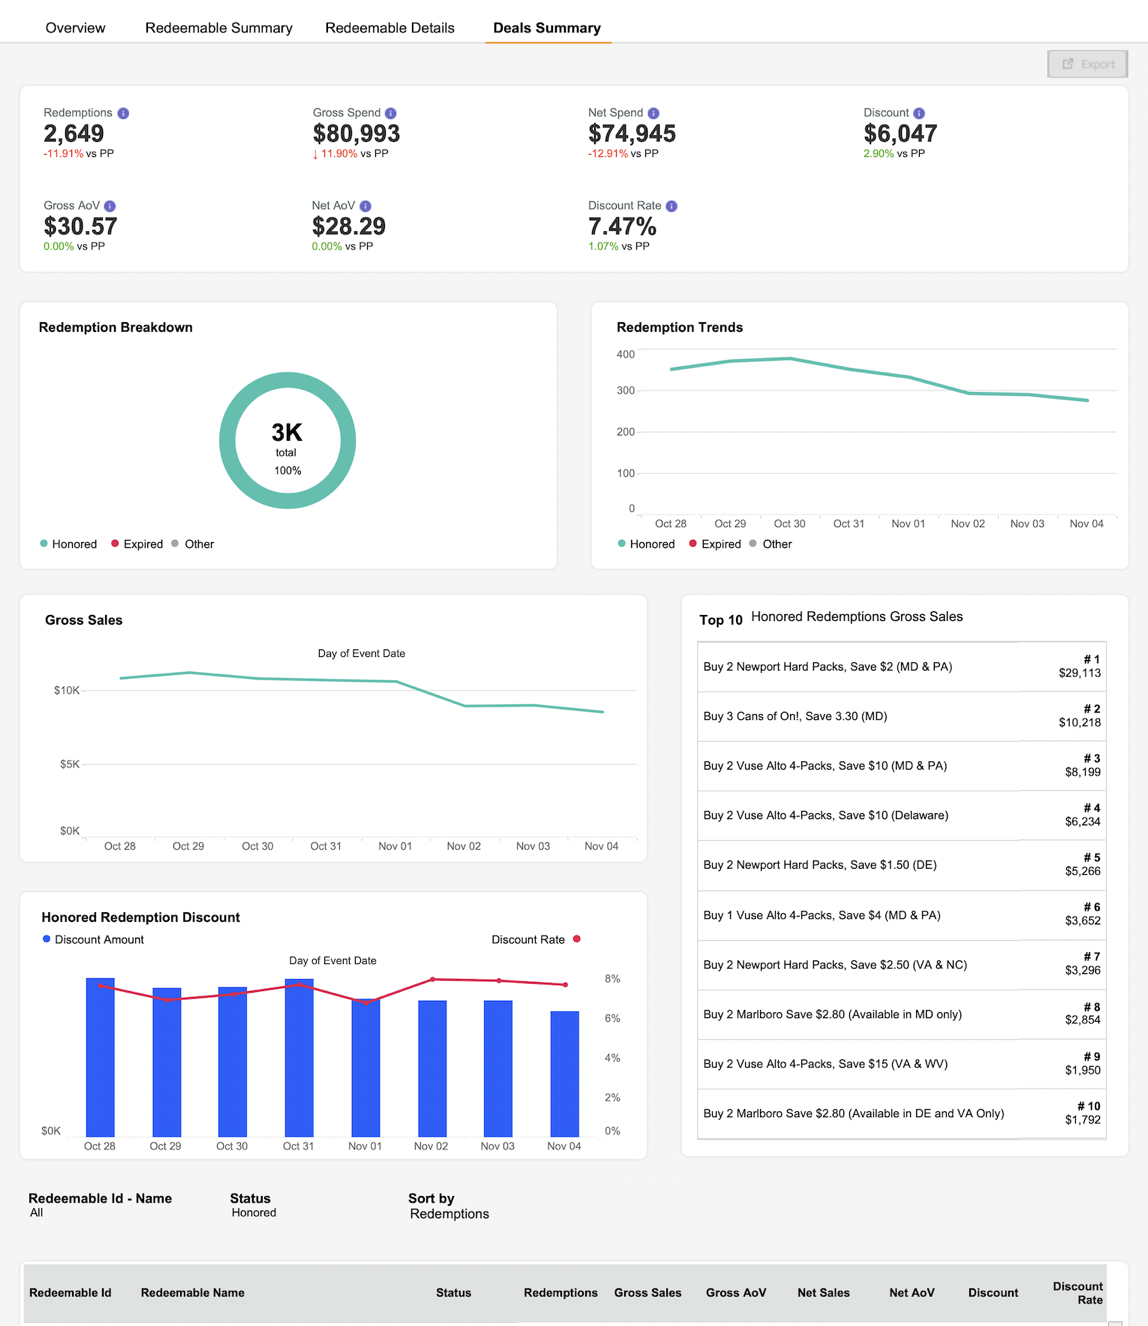
This report does not cover amount or discount-based promos/coupons. All the metrics in the dashboard are based on the date range and the locations you have selected.
Overall Metrics
The top section summarizes the report with seven metrics and the respective comparison to the previous period.

| Report Metric | Definition |
|---|---|
| Redemptions | Represents all redemption attempts, including successful, expired, etc. in a given time period specific to Deals. The successful redemptions (Honored Redemptions) are filtered based on the date-time stamp of the successful redemption in the business time zone. For unsuccessful/expired redemptions, the redemption attempt date-time stamp in the business time zone is used. The colors in the pie chart and the different lines in the line chart denote the redemptions by their respective status (honored, expired, etc.) |
| Gross Spend | Represents the total gross sales associated with all the transactions of which successful redemptions were a part, specific to Deals. |
| Discount | Represents the discount amount associated with all the transactions of which successful redemptions were a part, specific to Deals. |
| Net Spend | Gross Spend - Discount |
| Gross AoV | Gross Spend/Redemptions |
| Net AoV | Net Spend/Redemptions |
| Discount Rate |
|
Redemption Breakdown, Redemption Trends, Gross Sales, Honored Redemption Discount, and Top 10 Offers
Redemption Breakdown: Shows the breakdown of total redemptions by their status (Honored, Expired, and others) for the selected time frame and locations.
Redemption Trends: Shows the trends of total redemptions by their status (Honored, Expired, and others) for the selected time frame and locations over a period of time, specific to Deals.
Gross Sales: Shows the distribution of gross sales specific to Deals.
Honored Redemption Discount: Shows the distribution of the discount amount (bar chart) and discount rate, i.e., Honored Redemption Discount/Honored Redemption Gross Sales expressed as a percentage (line chart) over a period of time. This is specific to Deals.
Top 10 Offers: Top 10 offers (redeemable) are shown based on the metrics selected from the drop-down menu, i.e., Total Redemptions, Honored Redemptions, Honored Redemptions Discount, Honored Redemptions Gross Sales, specific to Deals.
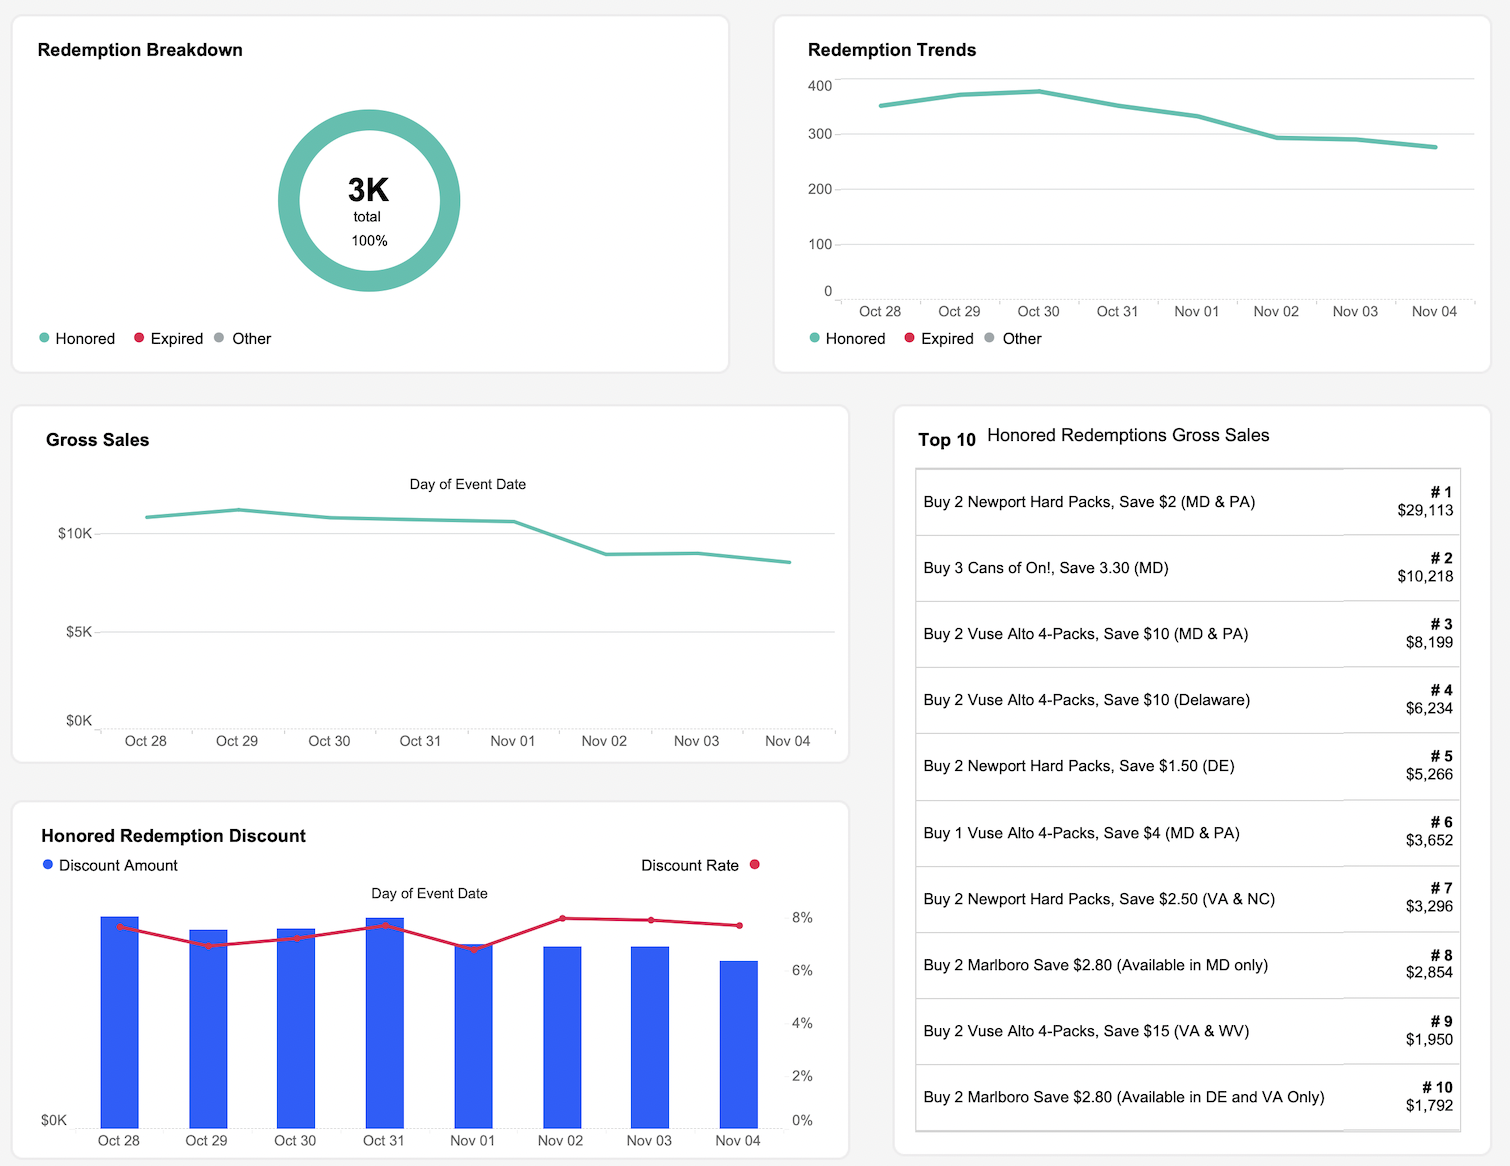
Redeemable Performance List
This view shows the performance of each redeemable based on the date range and locations you select, with one row per redeemable, reward origin, and redemption status, specific to Deals.
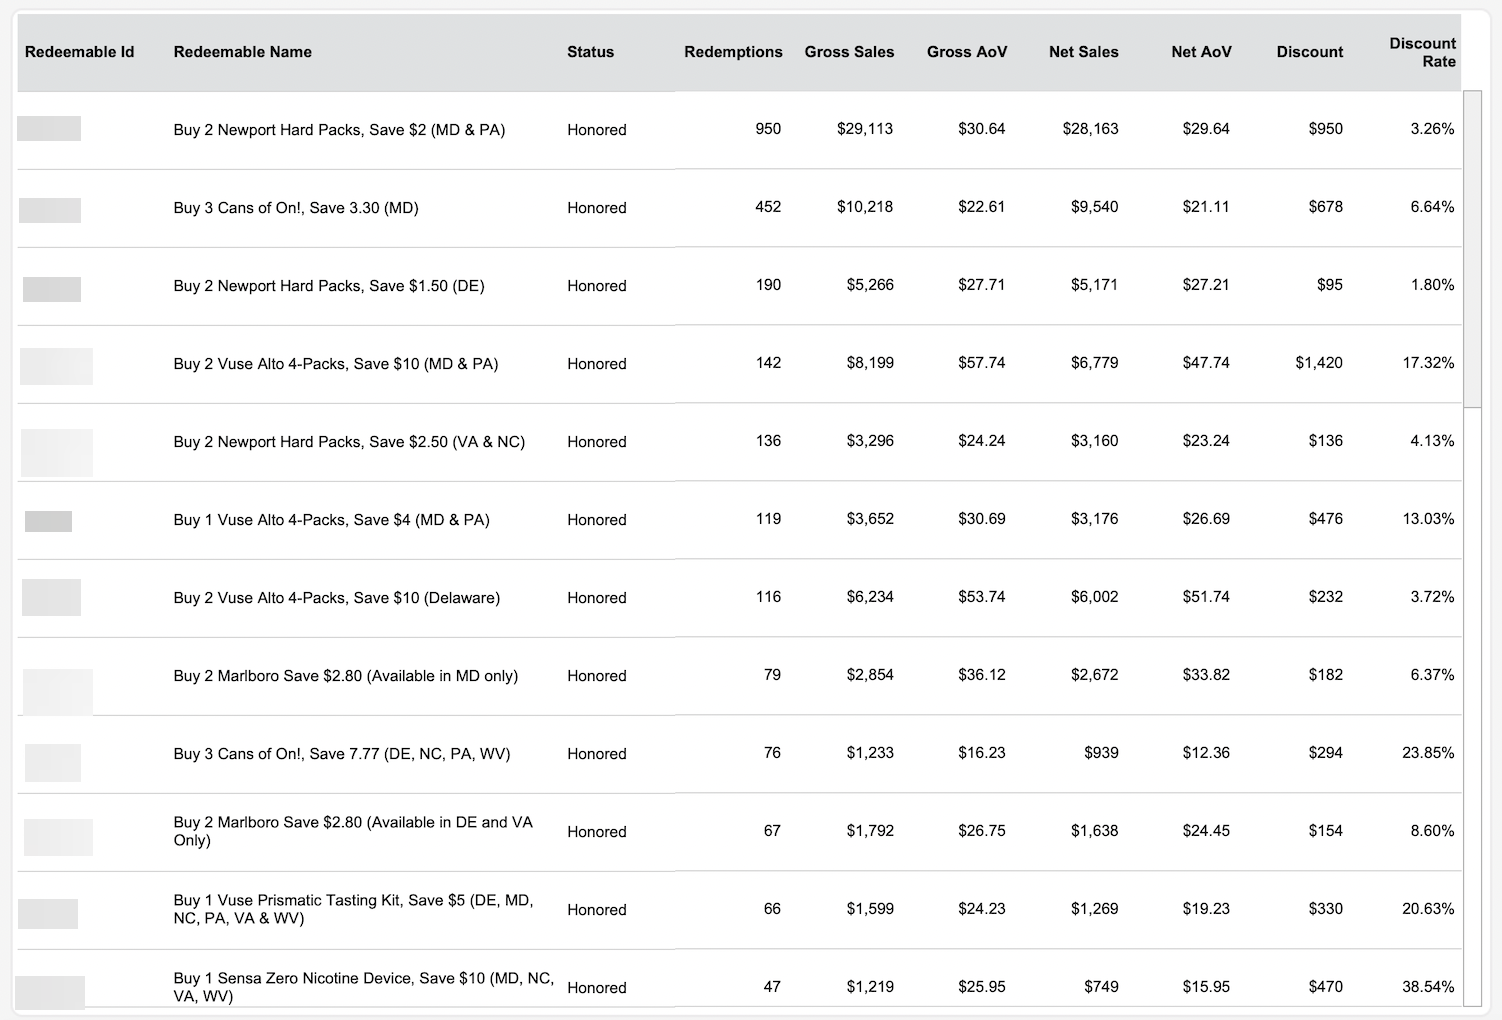
The following are the metrics shown for each Redeemable specific to Deals:
| Redeemable Metric | Definition |
|---|---|
| Redeemable ID | The unique identifier of a Redeemable on Punchh |
| Redeemable Name | Name of the Redeemable |
| Status | Represents the status of a redemption. Possible values include Honored, Expired, and Others (which include Staged or Unassigned Redemptions that weren’t successful). |
| Redemptions | Represents the count of redemptions for the given Redeemable ID from Deals. |
| Gross Sales |
|
| Gross AoV | Gross Sales/Redemptions |
| Net Sales | Gross Sales - Discount |
| Net AoV | Net Sales/Redemptions |
| Discount |
|
| Discount Rate |
|
Exporting
Click the Export button on the top right of the page as shown in the screenshots below, and select a sheet to download the data instantaneously to your local machine.