Dashboard (Landing Page)
The Dashboard landing page displays a wide range of visualized KPIs about your business, such as total loyalty checkins, total loyalty sales, and loyalty program signups, among other metrics. The Dashboard page offers a comprehensive overview of key loyalty program metrics and trends, empowering you to analyze performance and engagement effectively. Key capabilities include:
- Metric Overview: Displays critical metrics such as Loyalty Checkins, Loyalty Sales, Average Visits, Spend Lift, and Participation Rate, allowing you to assess overall loyalty program health.
- Trends Analysis: You can track trends in metrics such as Signups, Redemptions, and Discounts, providing insights into customer behavior over time.
- Channel Breakdown: Offers detailed breakdowns of Loyalty Checkins and Signups by various channels, helping identify the most effective touchpoints for engagement.
- User Engagement Insights: Highlights Top Spenders, Most Frequent Guests, and recent activities in Checkins and Redemptions to recognize key customers and their behaviors.
- App Performance Metrics: Shows App Downloads and differentiates between iOS and Android, enabling assessment of mobile engagement.
- Custom Date Range and Location Filters: You can select specific date ranges and filter metrics by locations or location groups, facilitating targeted analysis.
Overall the Dashboard page is a powerful tool for evaluating and optimizing loyalty program performance through detailed metrics and user-friendly filters.
Note:
- All data and metrics within the Dashboard are based on your business's set timezone.
- Data is refreshed every 4 hours.
- The loyalty metrics shown are based on scan time as opposed to receipt time. This means if a customer makes a transaction seven days ago (receipt time) but doesn't scan the receipt into their loyalty account until today (scan time), the data will show on the Dashboard for today.
While many types of dashboard data are available to Franchisees, only Corporate Admins may view information such as App Downloads and Signups. Additionally, Franchisees may be limited in the scope of the data they see, such as limiting which locations' data are shown.
Dashboard Metrics
Top Loyalty Program KPIs
Displays top-level KPIs showing how your loyalty program has performed at the specified location(s) during the time range.

| Metric | Description |
|---|---|
| Loyalty Sales | The sum revenue total of all loyalty transactions. Based on earnable items only (e.g. those that earn points), based on created at/scan time. |
| Spend Lift | The net percentage increase in the average per-check spend total for loyalty-based transactions vs. anonymous (non-loyalty) transactions. As determined by the following formula:
 |
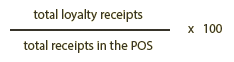
| Participation rate | Percent of POS transactions made by loyalty members who checked in. Determined by the following formula:
 |
| Average Visits | The total number of loyalty checkins divided by the total number of unique guests in the selected time duration. Tip: To determine if your average visits improve over time, compare this metric over the same length of date range for each item. For example, compare the last 30 days to the previous 30 days. |
Signups
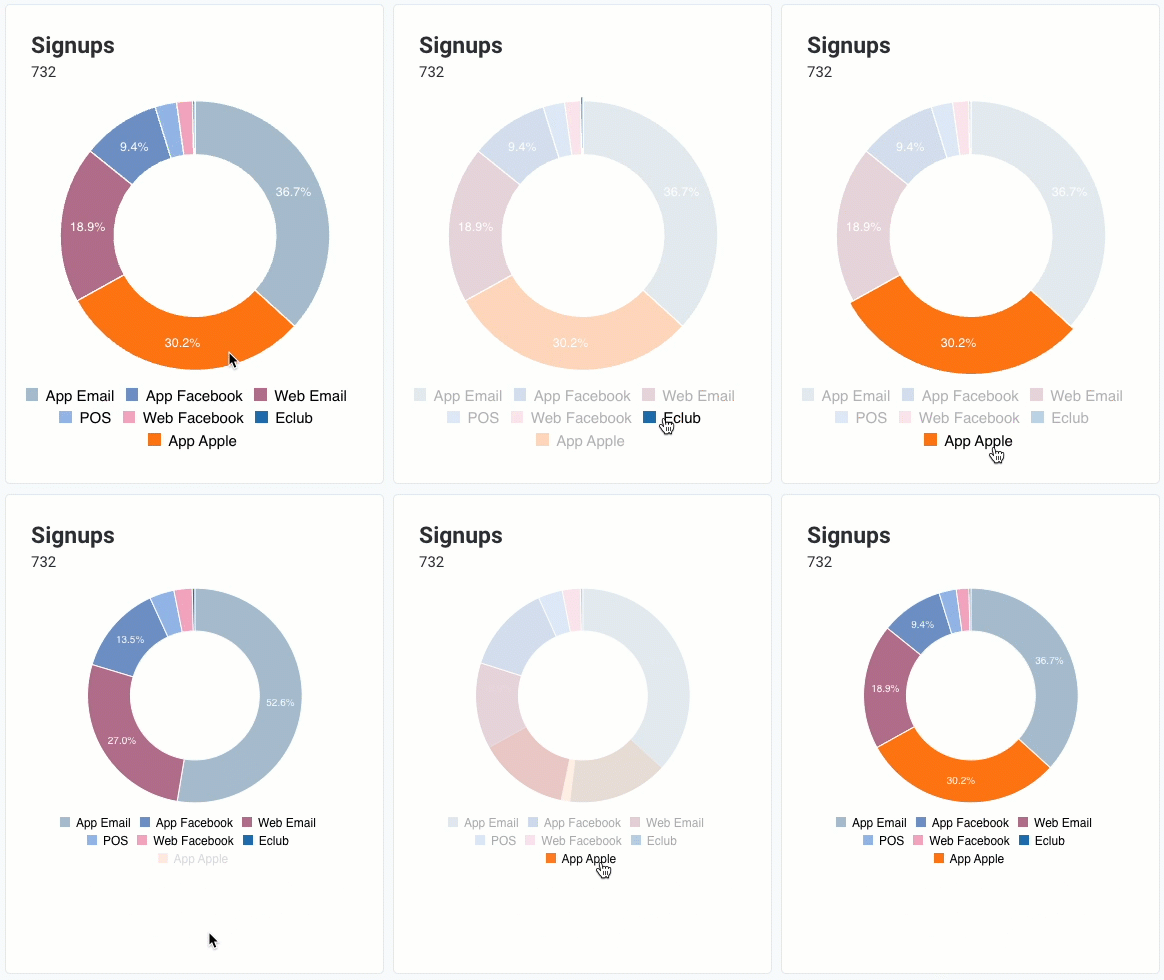
Lists the total number of guests who signed up for your loyalty program during the time range. While the signups are not captured at the location level, the guest's selection of FAVORITE LOCATION is used as a proxy to attribute the signup to a location. Additionally, this information is proportionally sorted by the method of signup each guest used, see list below. Scroll over the key at the bottom to highlight a specific signup method. Click one of the signup types to either include or exclude it from the total graph.
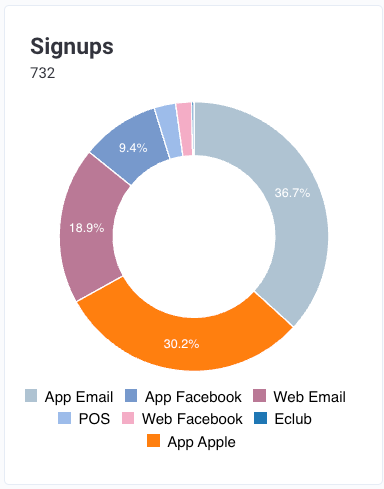
- App Email: Guests who signed up through the mobile app by entering their email address.
- App Facebook: Guests who signed up via Facebook SSO through the mobile app.
- App Apple: Guests who signed up via Apple SSO on the mobile app.
- App Google: Guests who signed up via Google SSO on the mobile app.
- Web Email: Guests who signed up through a webpage (such as an embedded iFrame) by entering their email address.
- Web Facebook: Guests who signed up through a webpage (such as an embedded iFrame) by connecting to/pulling info from their Facebook account.
- POS: Guests who signed up at the POS in person, usually after making a transaction.
- eClub: Guests that previously had an eClub-only account and converted to loyalty in the time period selected.
- SMS Loyalty: Guests who signed up via SMS/ Text-to-Join.
Note: The count for sign-ups may be different from the total count on the Analytics Audience page or Data Export depending on the time-zone setting. Learn more
Loyalty Checkins and Sales
Loyalty Checkins in the system are defined as the purchases made by loyalty guests for which they have earned points/punches. The graph shows total checkins and total loyalty sales at the specified location(s) during the time range. Hovering over the graph with your cursor will display totals for smaller time periods (a week if your date range is large, or by hour if your date range is very small.)
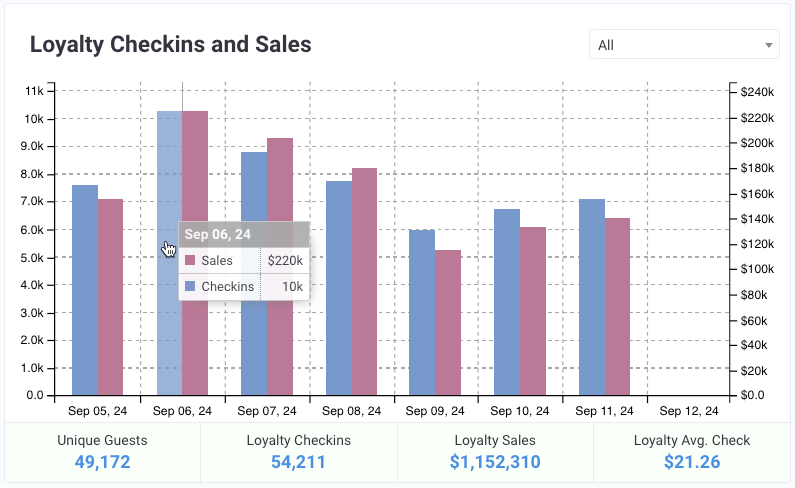
Click the All drop-down to toggle between types of sale data to display in the graph; Online Order, POS, Web, Mobile, or Dashboard can be selected, depending on your business settings. The amount totals at the bottom of the widget will change accordingly.
- Online Order: If your business is set up for online ordering, this represents the total loyalty checkins and total loyalty sales associated with online orders guests have placed. This can be either from your Online Ordering Website or using the mobile app to place an order and is not the same as if a guest were to scan their barcode. Checkins with integrated Online Ordering providers will occur automatically.
- POS: The total loyalty checkins and total loyalty sales made by loyalty members who checked in directly at the Point of Sale at the time of their transaction. This includes times when a guest provides a phone number, or their earning QR Code to the cashier during their transaction.
- Web: Number of loyalty checkins and total loyalty sales generated by all guests who checked in by logging into your business's iFrame. Not certain of what an iFrame is? Check out the definition here.
- Mobile: Number of loyalty checkins and total loyalty sales generated by all guests who checked in using the mobile app by means of scanning their barcode/QR code or by entering a barcode into the mobile app. Note: The primary difference between Mobile and Online Ordering checkins is the requirement of additional action, and are not automatic.
- Dashboard: This represents any loyalty checkins or total loyalty sales created in the POS Console. Note: The POS Console is only in use by brands that are not integrated with a POS. This metric does not display for most brands.
- Kiosk: Number of loyalty checkins made via Kiosk-type POS systems such as Bite or NEXTEP.
| Metric | Description |
|---|---|
| Unique Guests | The number of discrete guests who have made at least one loyalty checkin at the specified location(s) during the time range. |
| Loyalty Checkins | The total number of loyalty checkins made by unique guests during the time period. |
| Loyalty Checkins | The total amount of sales attributed to loyalty checkins across all channels where a guest may have made a purchase. |
| Loyalty Average Check | The average spend in dollars by loyalty guests, as determined by total loyalty sales divided by the number of all loyalty transactions. |
Loyalty Checkins
The total number of checkins at the specified location(s) during the time range. Additionally, this information is proportionally sorted by the method of checkin; Mobile, Point of Sales, Online Orders, or Other. Scroll over the key at the bottom to highlight a specific checkin method. Click one of the checkin types to either include or exclude it from the total graph.
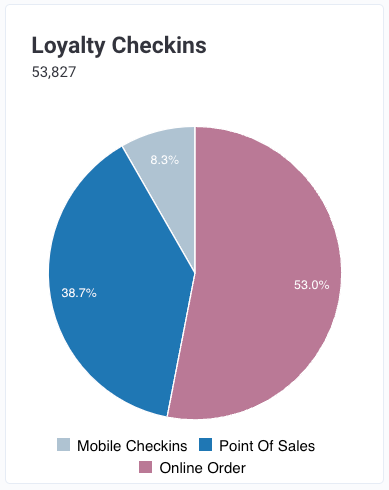
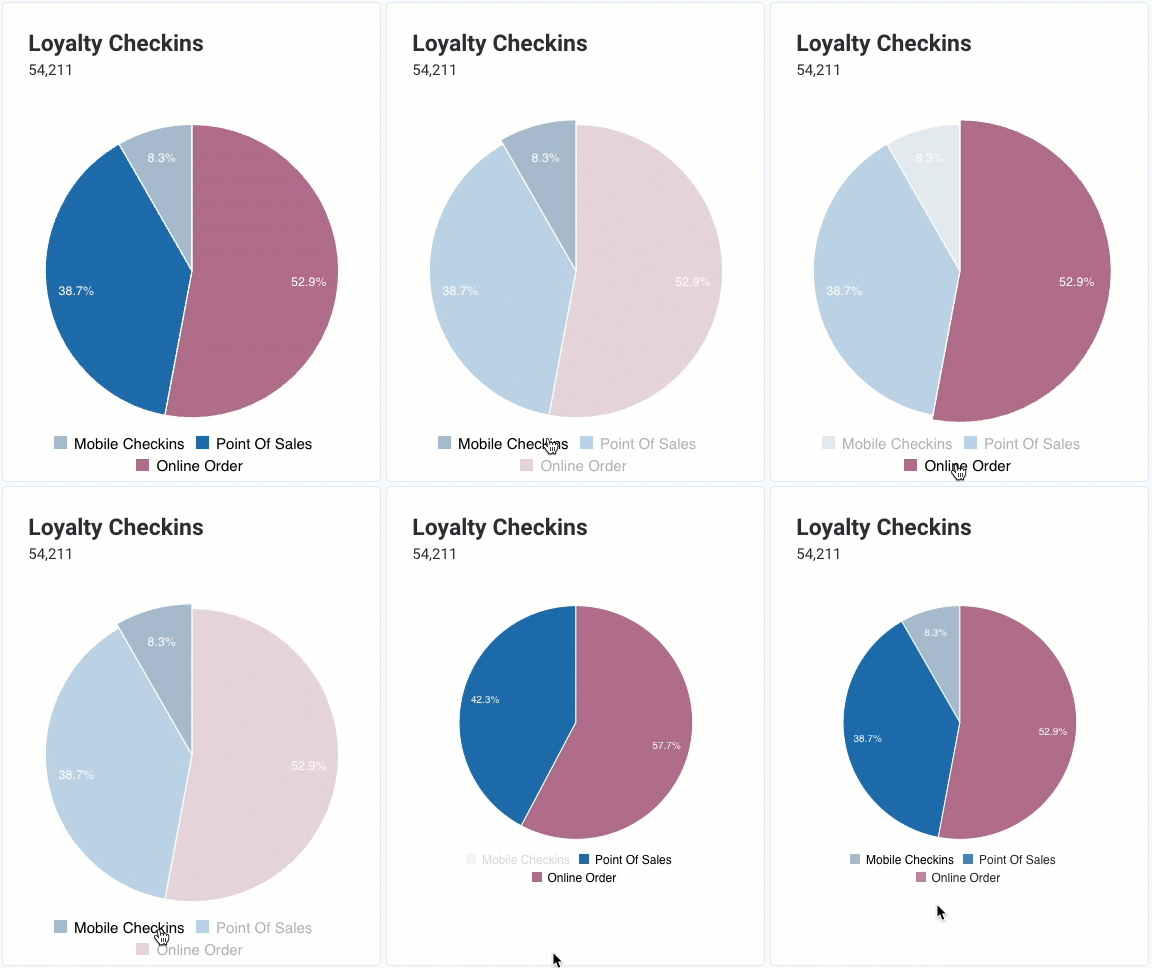
- Mobile Checkins - Checkins where the guest scans a receipt barcode with their mobile app. This occurs after the original transaction.
- Point of Sales - Checkins that take place at the POS at the time of the transaction, either through scanning a user's QR code or by entering the guest's ID information.
- Online Order - Checkins where a guest has placed an online order.
You will only see Online Orders if your business has enabled online ordering. - Other - "Other" covers checkins made through an iFrame you've set up, through POS Console, through Chatbot, etc.
Referrals
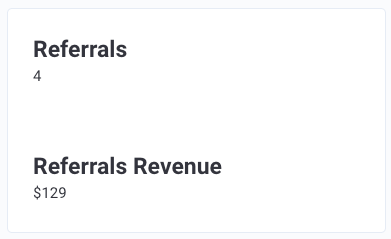
Referrals display the total number of new guests who signed up as a result of a direct referral from an existing customer. For example, if guest A refers guest B then referral is considered when guest B does a loyalty checkin. Referrals Revenue is considered as the total revenue generated by those new guests on their first visit.
Reviews
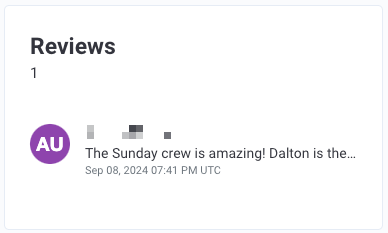
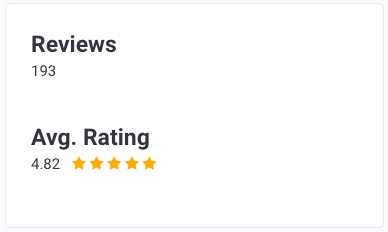
Reviews display the total number of reviews (feedback as well as ratings) submitted by guests about your business during the time period, and the average rating score provided by those guests' feedback during the time period, not lifetime rating. If there are no ratings, the text of recent feedback made by a user will be displayed.
Redemptions & Sales
Redemptions in the system are defined as purchases where guests have used a code to redeem an offer given by the business. Sales refers to the amount on receipts on which redemption is done. The graph shows total redemptions and total loyalty sales at the specified location(s) during the time range. Hovering over the graph with your cursor will display totals for smaller time periods (such as a week if your date range is large, or by hour if your date range is very small.)
Note: When you select "All", the Redemptions (and the Gross Sales, Discounts) reflect the values for all types of redemptions workflows, including the ones where redemptions are done against Promo and Coupon campaigns configured with the option of "Directly processed at POS". Therefore, the values will not align with the metric values in the Redemption Report, which does not consider Redemptions done against Promo and Coupon campaigns configured with the option of "Directly processed at POS". For more information on the different redemption workflows in the Punchh platform, please refer to Understanding Punchh Data: Redemption Workflows.
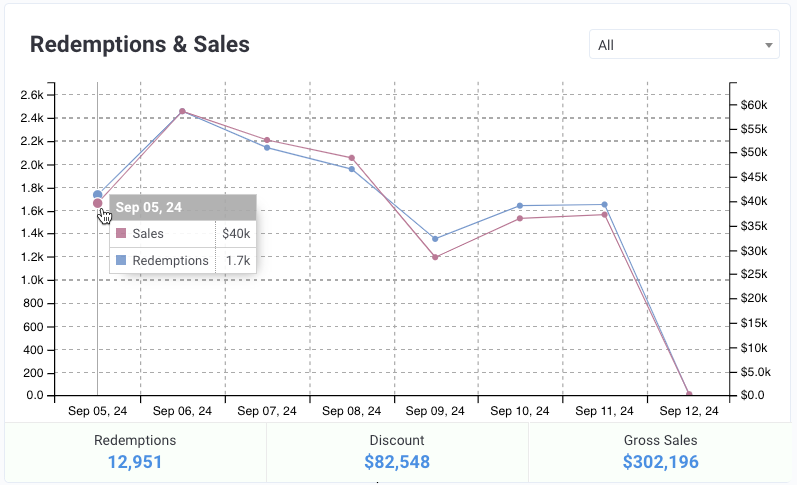
Click the All drop-down to toggle between the sources of the redemptions to display in the graph; Loyalty, Campaign, or Coupon can be selected, depending on your business settings. The amount totals at the bottom of the widget will change accordingly.
- Loyalty: Includes rewards gifted to guests on completion of a loyalty goal. This can include redeemable or banked rewards.
- Campaign: Includes gift-bearing campaigns comprising mass gifting, post checkin, and ongoing campaigns. It also includes redemptions done against Promo and Coupon campaigns configured with the option of "Unlock Rewards on Mobile App".
- Coupon/Promo: Includes redemptions processed as a result of guests using a coupon or promo code. Only the redemptions done against Promo and Coupon campaigns configured with the option of "Directly Processed at POS" are considered.
- Other: Includes redemptions of gifts that were given to guests by Admins, typically through support messages/gifting
| Metric | Description |
|---|---|
| Redemptions | For POS POS-integrated business, this represents the total number of processed (honored) redemptions at the specified location(s) during the time range. For non-POS integrated businesses, both processed (honored) and expired redemptions are counted. |
| Discount | For POS-integrated businesses, this represents the total value discounted or awarded on receipts where redemption was processed (honored). For non-POS integrated businesses, this total includes both processed (honored) and expired redemption receipts. |
| Gross Sales | The gross revenue generated by receipts that included a redemption at the specified location(s) during the time range. |
Campaigns
Revenue
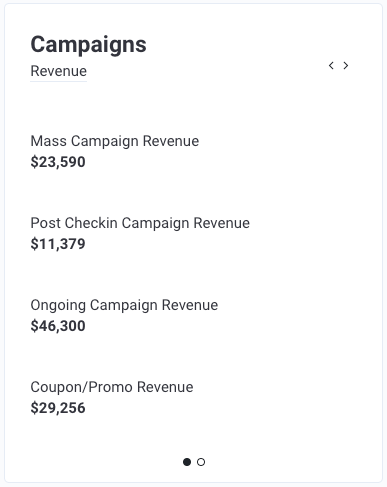
The Revenue tab displays the total amount of money earned by each type of campaign you have run/are currently running. Notice that this is the total between ALL campaigns of that type. So if you have 15 Post Checkin Campaigns, the revenue value shown here represents the combined total of all 15 of those campaign types.
| Metric | Description |
|---|---|
| Mass Campaign Revenue | Gross spend for processed redemptions associated with all Mass gifting campaigns (discounts are not factored in this calculation) |
| Post-Checkin Campaign Revenue | Net spend generated from Post-checkin campaigns that are gift-bearing. (Notification-only campaigns are not included). |
| Ongoing Campaign Revenue | Gross revenue generated from all Ongoing campaigns, such as Signup, Referral, and Anniversary campaigns. |
| Coupon/Promo Revenue | Gross revenue generated from whenever a coupon or promo code is redeemed. |
Recent
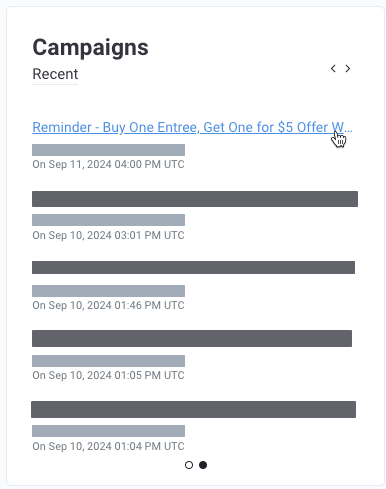
The Recent tab displays a list of campaigns that have been created by your company's users in Punchh, ordered by recency. Click the name of a campaign to view its analytics/summary page, or click the title Campaigns to move to the top-level Campaigns page.
Only admins with proper permissions may view campaign details.
Guests
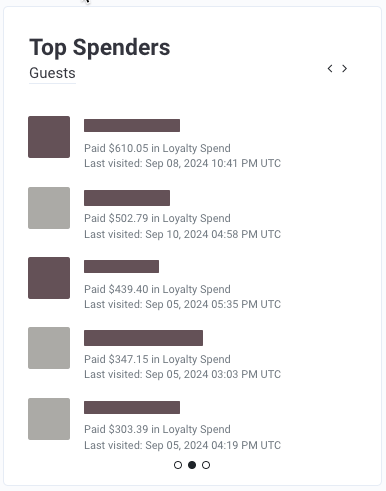
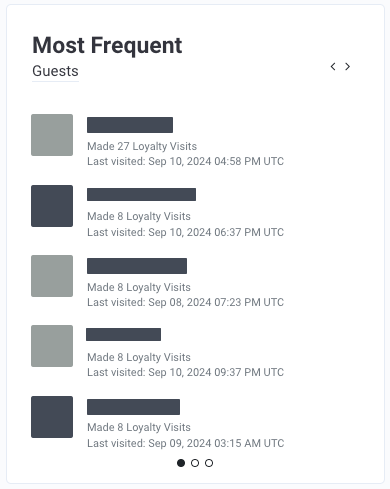
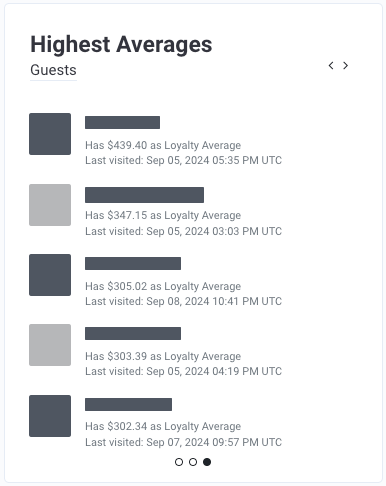
This revolving widget displays a list of your best customers during the selected timeframe, cycling through top spenders, most frequent, and highest average check total. Admins with adequate permissions may click on a guest's name to view their profile. The widget will automatically cycle between the three data types, but you can click on the arrows at the top or the circles at the bottom of the window to more quickly cycle between them.
Top Spenders
Top Spenders shows the list of guests with the highest net spend during the time period.
Most Frequent
Most Frequent shows the list of guests with the highest total number of loyalty checkins logged during the time period.
Highest Averages
Highest Averages shows the list of guests with the highest average check totals during the time period, as determined by the guest's net spend divided by their total number of receipts.
App Downloads
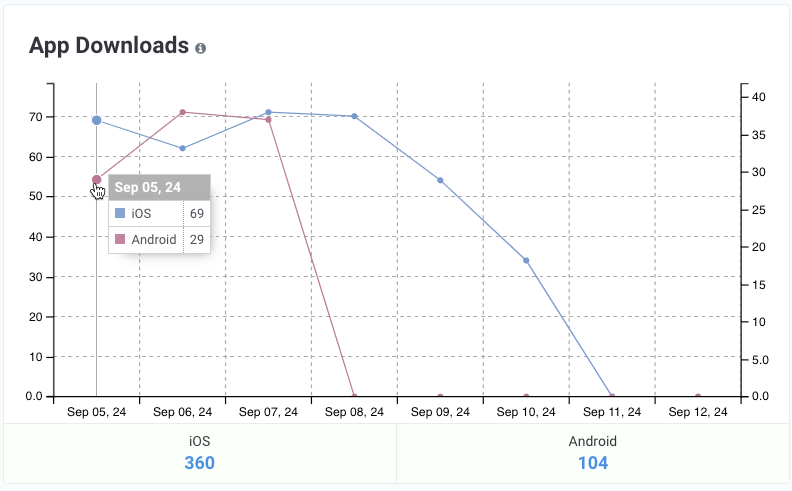
Tracks the total number of downloads on both iOS and Android devices over the time period (App Downloads are not location-specific). Hover over the line graph to view quantitative details for that specific day, week, or month (depending on how long of an overall timeframe you've chosen). The count of downloads is dependent on a 3rd party service so data may not match at times when we haven't received the data from that service. It can take up to three days (72 hours) for the data from App Figures, the service provider for App download data, to reflect on the Dashboard.
Activity
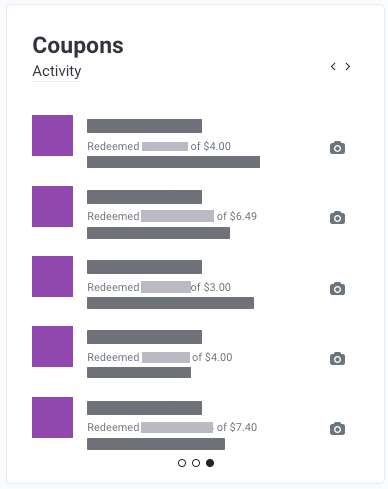
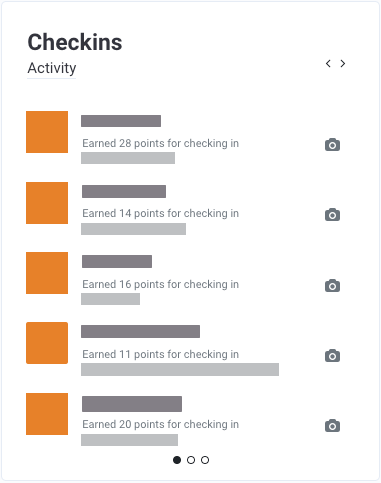
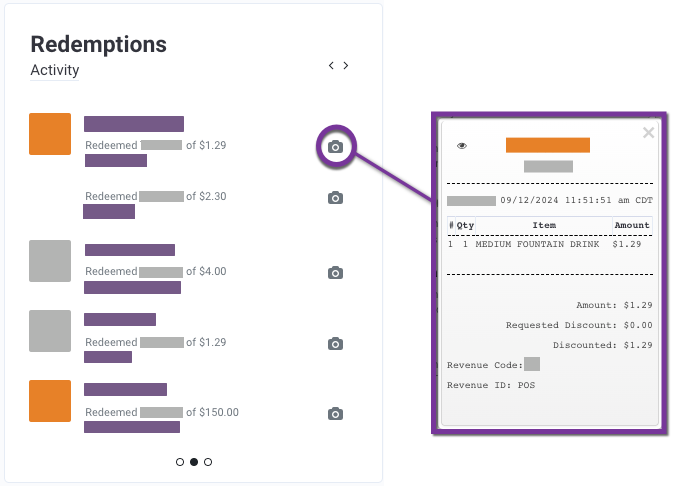
This revolving widget displays a list of some recent guests who have completed a checkin, used a redemption, or redeemed a coupon (if you have the Coupons added module). Admins with adequate permissions may click on a guest's name to view their profile or click on the Camera icon to view the receipt for that transaction. The widget will automatically cycle between the three data types, but you can click on the arrows at the top or the circles at the bottom of the window to more quickly cycle between them.
Checkins
Redemptions
Coupons