Lapsed Guests Trend
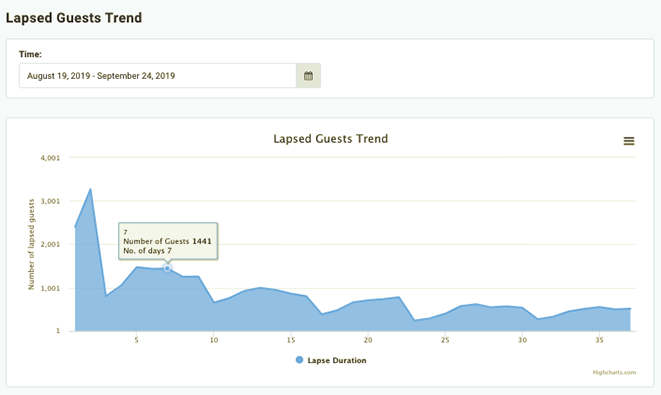
The Lapsed Guests Trend dashboard shows a running timeline identifying how long it's been since individual loyalty guests have visited one of your stores (checked in). Users are grouped based on how many days since their last activity, creating a trend graph useful for identifying curious patterns of guest behavior that may influence the durations you set for Recall campaigns.
Understanding the Lapsed Guests Trend Dashboard
The Lapsed Guests dashboard consists of a Lapse Duration trend graph and Calendar and List views. Each data point on the trend graph is derived by collecting the total guests who have not been active for exactly 1 day, 2 days, 3 days, etc., counting backward from the current date. The Calendar and List views display that same information, just in different forms.
Calendar View
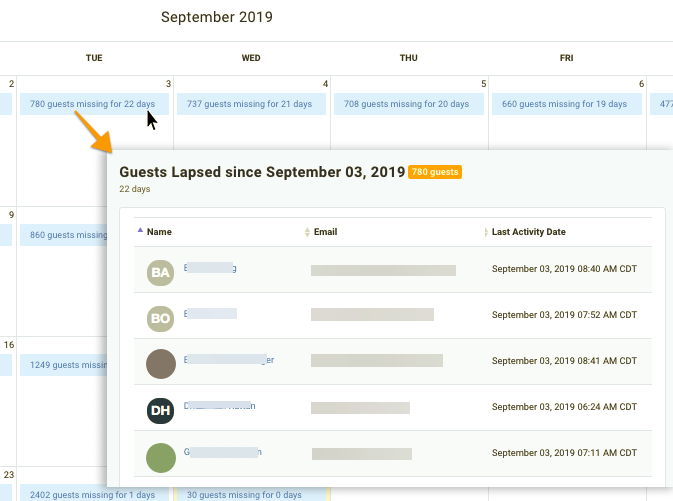
Each date in the Calendar view shows the number of guests whose last activity took place on that date. So, for example, we can see that 780 guests were last active on Sept 3rd. These numbers will change daily, decreasing as guests in that lapsed duration visit/checkin again, resetting their last active date to that new date.
Click on one of the dates to see a complete list of all the guests last active on that day.
List View
The List view shows the same information with more attention paid to the lapse duration (in days) than the last active date (Calendar view). As shown in the screenshot below, dates/durations where a Recall campaign is triggered are highlighted in green. In this example, 536 guests were last active 30 days ago; those guests are just today entering that Recall campaign's segment and will be contacted and incentivized based on that campaign.
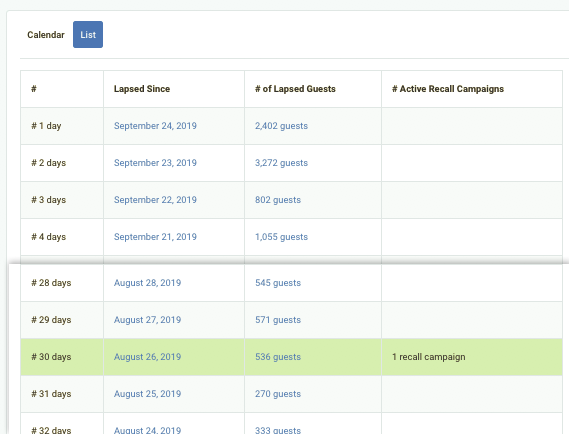
Click on a date or number of guests to show a detailed list of those users in the pane to the right.