Feedback Sentiment
After you've set up the ability for guests to provide feedback through your mobile app, you may be finding it difficult to parse through individual reviews to gain broader insights about areas where your business is succeeding and areas where improvement may be made. This is where Feedback Sentiment analytics comes in.
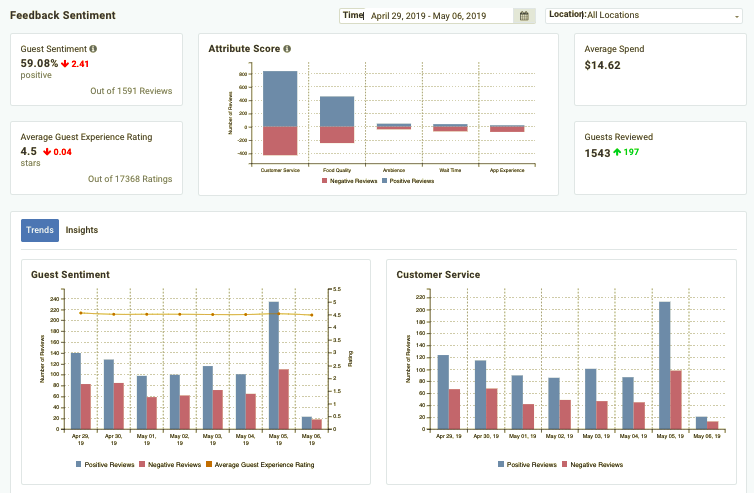
Feedback Sentiment analytics analyzes all of your reviews into positives and negatives across several attributes of your business (such as Customer Service, Food Quality, Ambience, Wait Time, and App Experience). It does so by using a sophisticated algorithm to identify language in each review that relates to each of those areas. This allows you to capture more nuance from your reviews than a simple numerical ratings score and can show you more broadly where you are succeeding/failing and whether these areas are trending better or getting worse. Additionally, turning on Feedback Sentiment analytics adds a Sentiment bar to each review on your Feedback listing page.
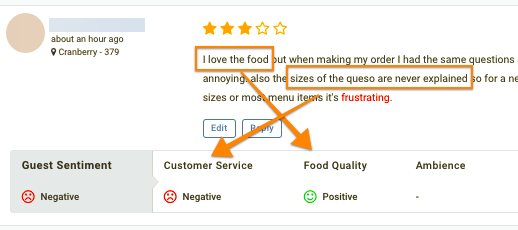
Feedback Analytics Metrics
Located in Store Locations > Feedback Sentiment, the Feedback Sentiment scoreboard shows quantified feedback across a specified time period, split into areas of the guest experience. The values and trends shown are based on the Time period and Locations you select. The following data metrics are included:
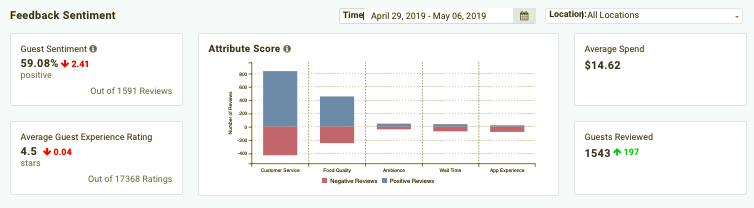
- Guest Sentiment: The average percentage of positive/negative ratings/reviews during the time period. This value is independent of the numerical rating a guest has given. For example, if a guest gives a 5-star rating but in their accompanying comment complains that their food was cold, this is counted as negative guest sentiment.
- Average Spend: The average check total for transactions that prompted a rating/review during the time period.
- Average Guest Experience Rating: The average numerical score for all the ratings given by guests during the time period.
- Guests Reviewed: The number of unique guests who provided comments along with their numerical rating. The text content of these reviews is what the Feedback Sentiment algorithm analyzes.
- Attribute Score: A representation of the amount of reviews that contained either positive (blue) or negative (purple) sentiments for each component (attribute) of the customer experience as expressed during the specified time period. Hover over one of the bars for a numerical total for that attribute.
Trends
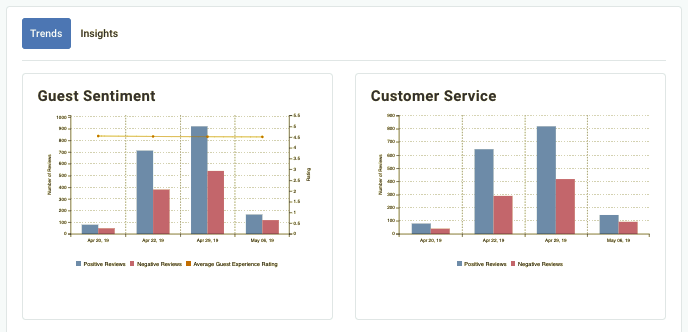
The Trends tab shows breakdowns of the volume of negative and positive sentiment made about each of the customer experience attributes; Customer Service, Food Quality, Ambience, Wait Time, and App Experience. The totals are shown at various time intervals, depending on your selected time duration. For example, if you set your duration to a week, the intervals will be daily.
| Attribute | Definition |
|---|---|
| Guest Sentiment | Shows the average numerical rating of positive/negative reviews (based on sentiment) at various intervals over the specified time period. The dark orange line represents the combined average of all positive and negative reviews on that interval. Remember that a positive review may have a low rating and a negative review may have a high rating. For these purposes, these two metrics are independent. |
| Customer Service | The most common attribute talked about in review comments. Reviews containing such phrases as "the cashier was rude" or "they did a great job" are classified as customer service-related. |
| Food Quality | The second most common attribute mentioned in review comments. Reviews containing phrases such as "my tacos were cold" or "the steak was delicious" are classified as food quality-related. |
| Ambience | Anything to do with the physical state, appearance, or general feel of the store/location. Phrases such as "the restrooms were dirty" or "the place has a really cool vibe" are classified as ambience-related. |
| Wait Time | Anything to do with the speed of service, seating, food preparation, etc. Phrases such as "our appetizers took forever" or "we were seated right away" are classified as wait time-related. |
| App Experience | Comments about the mobile app. Phrases such as "the app crashed" or "online ordering was really smooth" are examples of app experience-related phrases. |
Insights
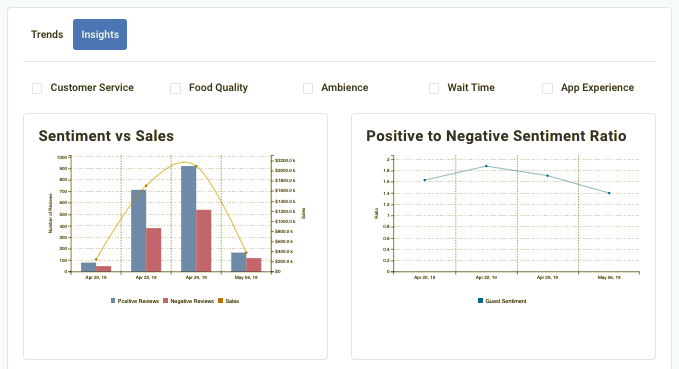
The Insights tab contains information about the relationship between sales volume and sentiment as well as a leaderboard for best and worst-reviewed locations during the time period. You can focus on specific attributes by checking the boxes at the top of the tab. Checking the boxes for Customer Service and Food Quality will show only reviews concerning those attributes. Leaving all the boxes unchecked will include all reviews.
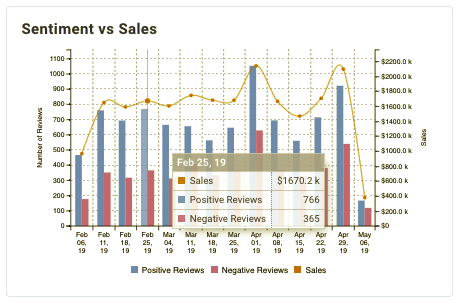
Sentiment vs Sales
This graph represents the number of positive/negative reviews for the selected attributes in the context of how they relate to total sales for that particular time period. For example, a spike in negative reviews as sales totals rise might indicate that customer service is negatively affected the busier things get.
Naturally, the overall volume of positive and negative reviews will be greater as the sales totals tick up. More transactions equals more chances for customers to give reviews. Using this data in conjunction with the Positive to Negative Sentiment Ratio data graph can help to show if/how quality of service is affected by periods of increased sales.
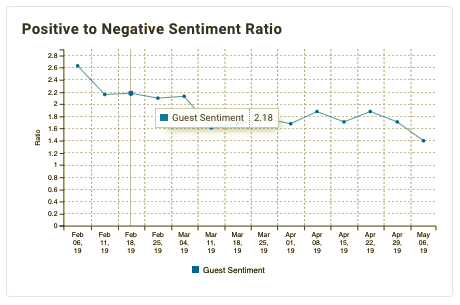
Positive to Negative Sentiment Ratio
This graph represents the ratio of positive reviews to negative reviews. For example, if there are 500 positive reviews and 300 negative reviews, the Guest Sentiment ratio would be 1.6 (500/300). If there are 500 positive and 500 negative reviews, the ratio would be 1.0 (500/500). The higher the ratio, the better you're doing.
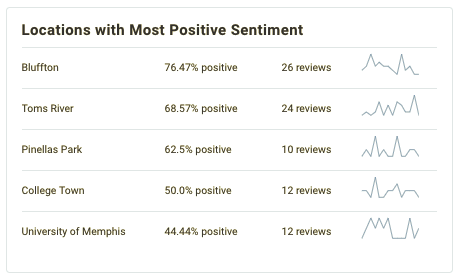
Locations with Most Positive Sentiment
Based on reviews over the time period, this is a leaderboard of locations with the greatest percentage of positive guest sentiment reviews.
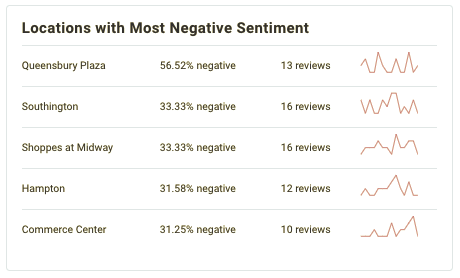
Locations with Most Negative Sentiment
Based on reviews over the time period, this is a leaderboard of locations with the greatest percentage of negative guest sentiment reviews.
Note: These leaderboards may appear blank if not enough locations have received an adequate amount of reviews over the time period (minimum 10 reviews). Try increasing the time duration if nothing is showing up.
Create a Guest Based Feedback Segment
Click on any of the bars in the Attribute Score graph to create a new guest segment based on that particular set of guests who left positive/negative reviews during that time period.
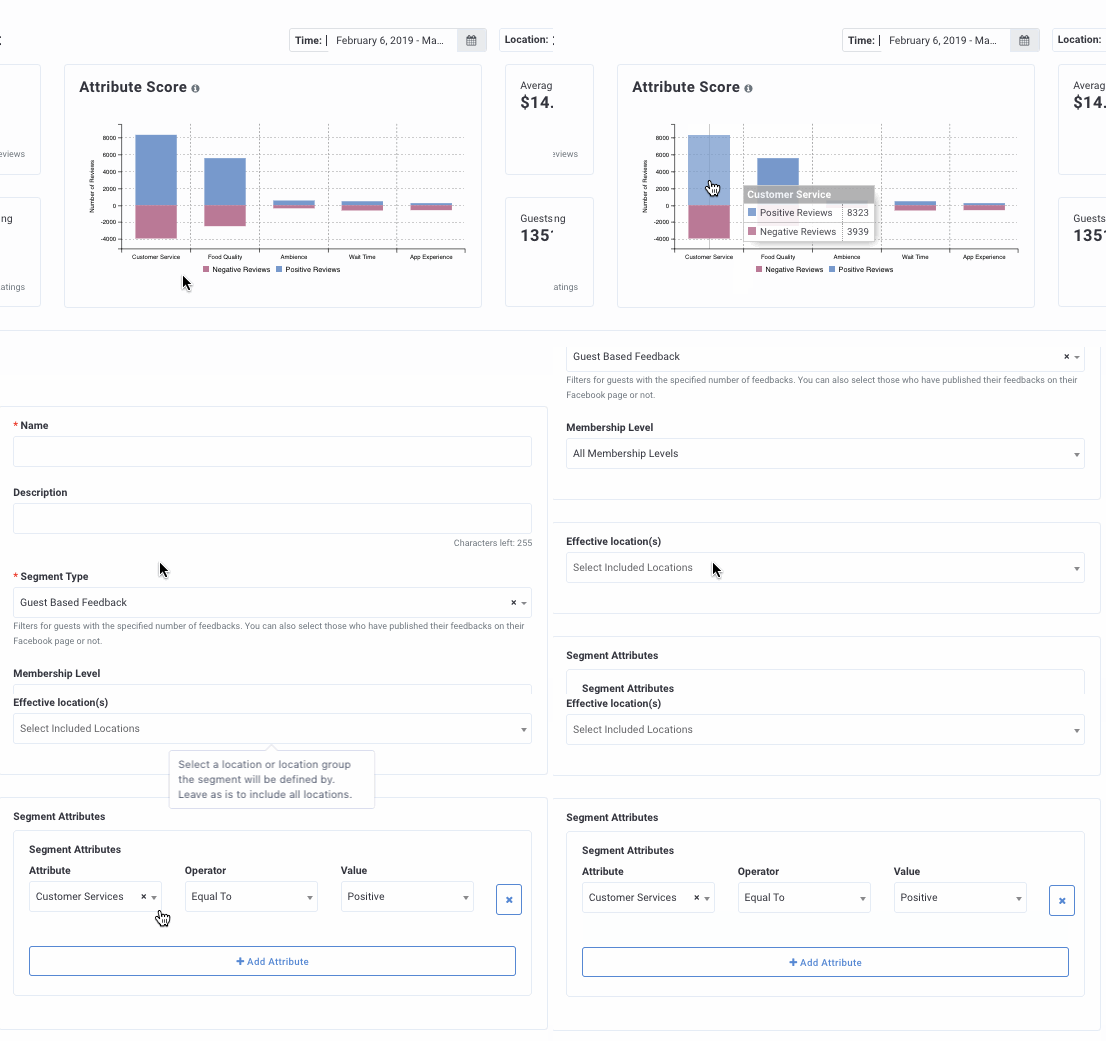
When creating a Guest Based Feedback segment, you can choose from any of the guest sentiment attributes and specify positive or negative sentiment.
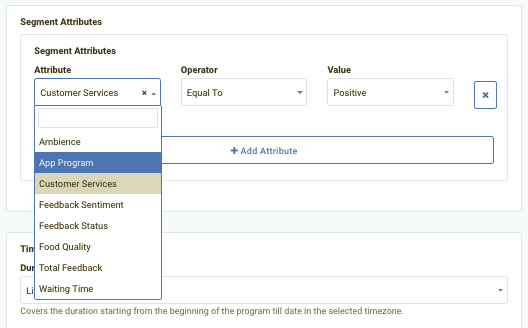
Feedback Status refers to published/unpublished reviews.