Fraud Analytics Report
The Fraud Analytics dashboard provides a comprehensive summary of fraudulent activity and patterns for your brand based on three main areas:
- Activity rules setup
- Employee transactions
By leveraging data analysis and visualization techniques, the dashboard provides a comprehensive overview of fraudulent activities, enabling you to identify potential vulnerabilities, patterns, and trends.
The primary objective of a fraud analytics dashboard is to assist you in detecting and preventing suspicious activities. To achieve this objective, the dashboard offers three navigation options that allow you to identify suspicious patterns and anomalies. Navigate to Loyalty Program > Fraud Analytics Report to view the dashboard by specific tabs.
Data Refresh Frequency
The Fraud Analytics dashboard is refreshed at the following two intervals:
- Incremental: Every day at 5 AM UTC (only the new data will get appended to the extract)
- Full: First Sunday of every month at 4 PM UTC (all additions and deletions will be considered)
Activity Tab
This feature allows you to detect fraudulent activity based on eight predefined rules set up by brand marketers. The By Activity navigation provides you with the ability to monitor fraudulent transactions based on frequency, day, hour, and location.
Select the filters at the top of the page to modify your data results by Time (Date Range) and Location.
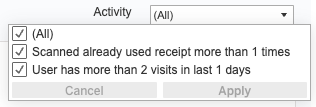
Use the Activity drop-down to filter by activity type:
To view user details or lists for any of the metrics available on the dashboard, simply click on the desired metric and then select 'Show/Hide User Details.' This will display the user details specific to that metric
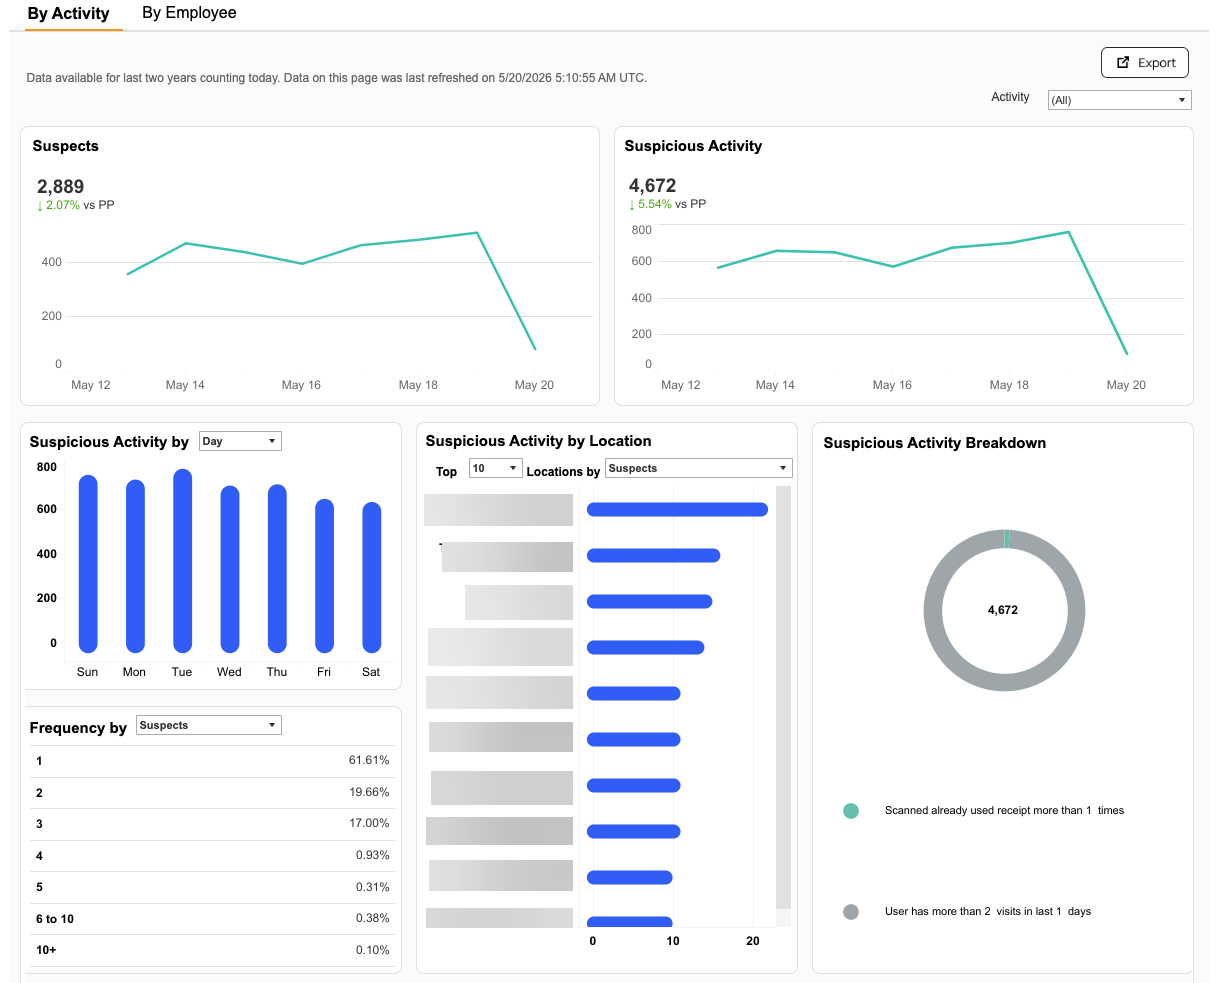
- Suspects: Number of guests involved in any suspicious activity within the selected date range. Also, it shows a % increase or decrease from the previous period.
- Suspicious Activity: Number of activities that have violated predefined rules during the selected date range. Also, it shows a % increase or decrease from the previous period.
- Suspicious Activity by Day or Hour: Total number of suspicious activities that occurred on a specific day or during a specific hour of the day
- Suspicious Activity by Location: Top 10 locations based on the number of suspects or suspicious activities, enabling users to identify locations with the highest frequency of suspicious activity/suspects.
- Suspicious Activity Breakdown: Number of transactions that violate specific activity rules.
- Frequency by
- Suspects: Percentage of guests who have violated the rule of engaging in N number of suspicious activities, which may be the same or different activities.
- Suspicious Activity: Percentage of guests who have violated the rule of engaging in a specified number of different suspicious activities, out of all the activity rules during the selected date range.
Employee Tab
The By Employee navigation allows you to monitor transactional details at an employee level, including total transactions, sales, discounts, etc. Employee data is plotted on a scatter plot, making it easy to identify outliers, and a detailed breakdown of employee data is available at the bottom of the page.
Select the filters at the top of the page to modify your data results by Time (Date Range) and Location. Use the Employee ID drop-down to filter by a specific employee.
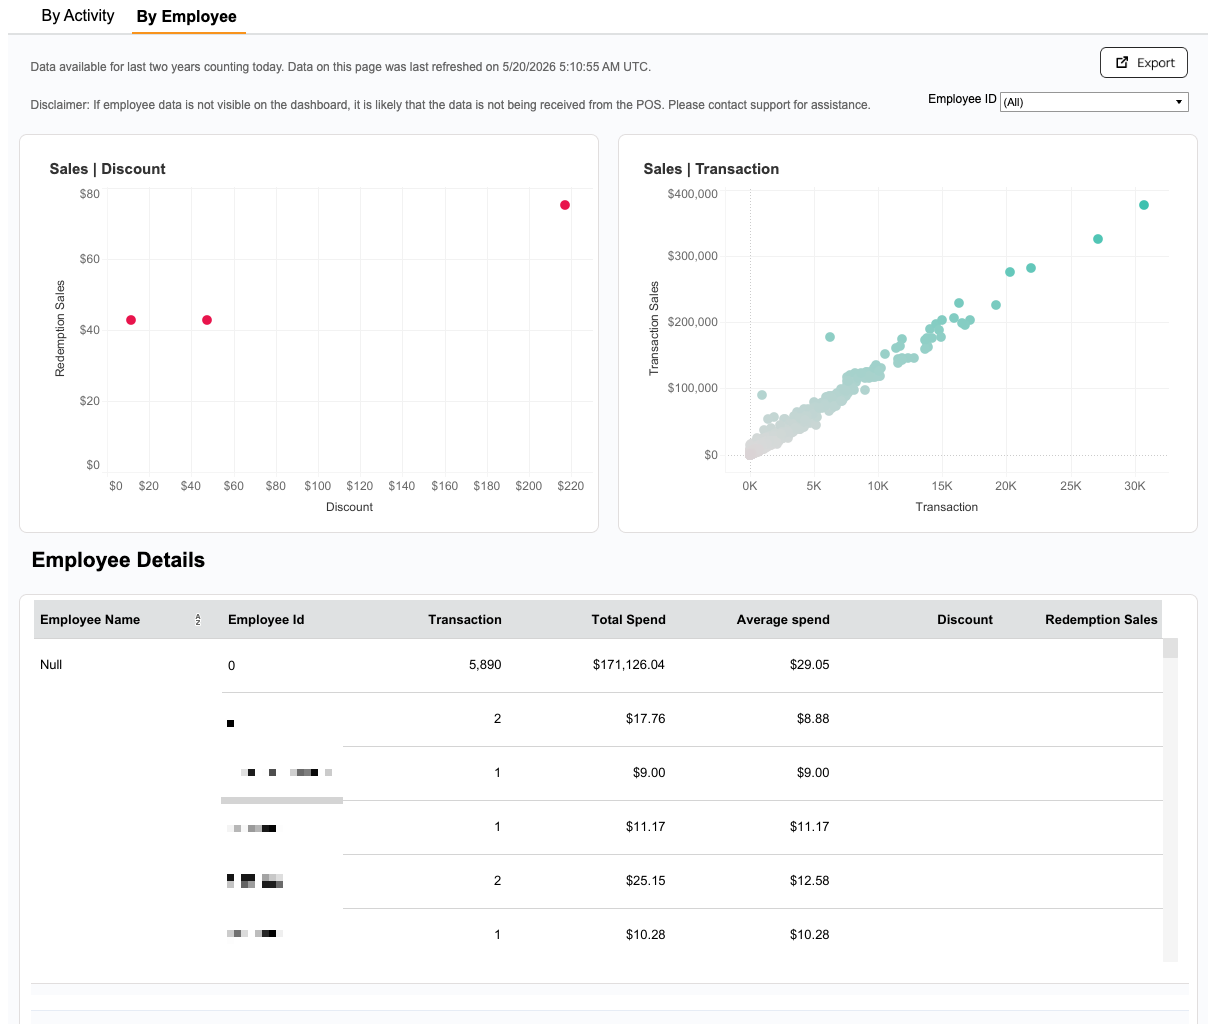
- Sales | Discount: Plots employee details on redemption sales (Y-axis) versus discount (X-axis), with a circle representing each employee and their corresponding sales and discount data.
- Sales | Transaction: Plots employee details on transaction sales (Y-axis) versus transactions (X-axis), with a circle representing each employee with their corresponding sales and transaction data.
- Employee Details: All transactional details related to a single employee. This allows for a more thorough understanding of their activities and performance.