Email Analytics
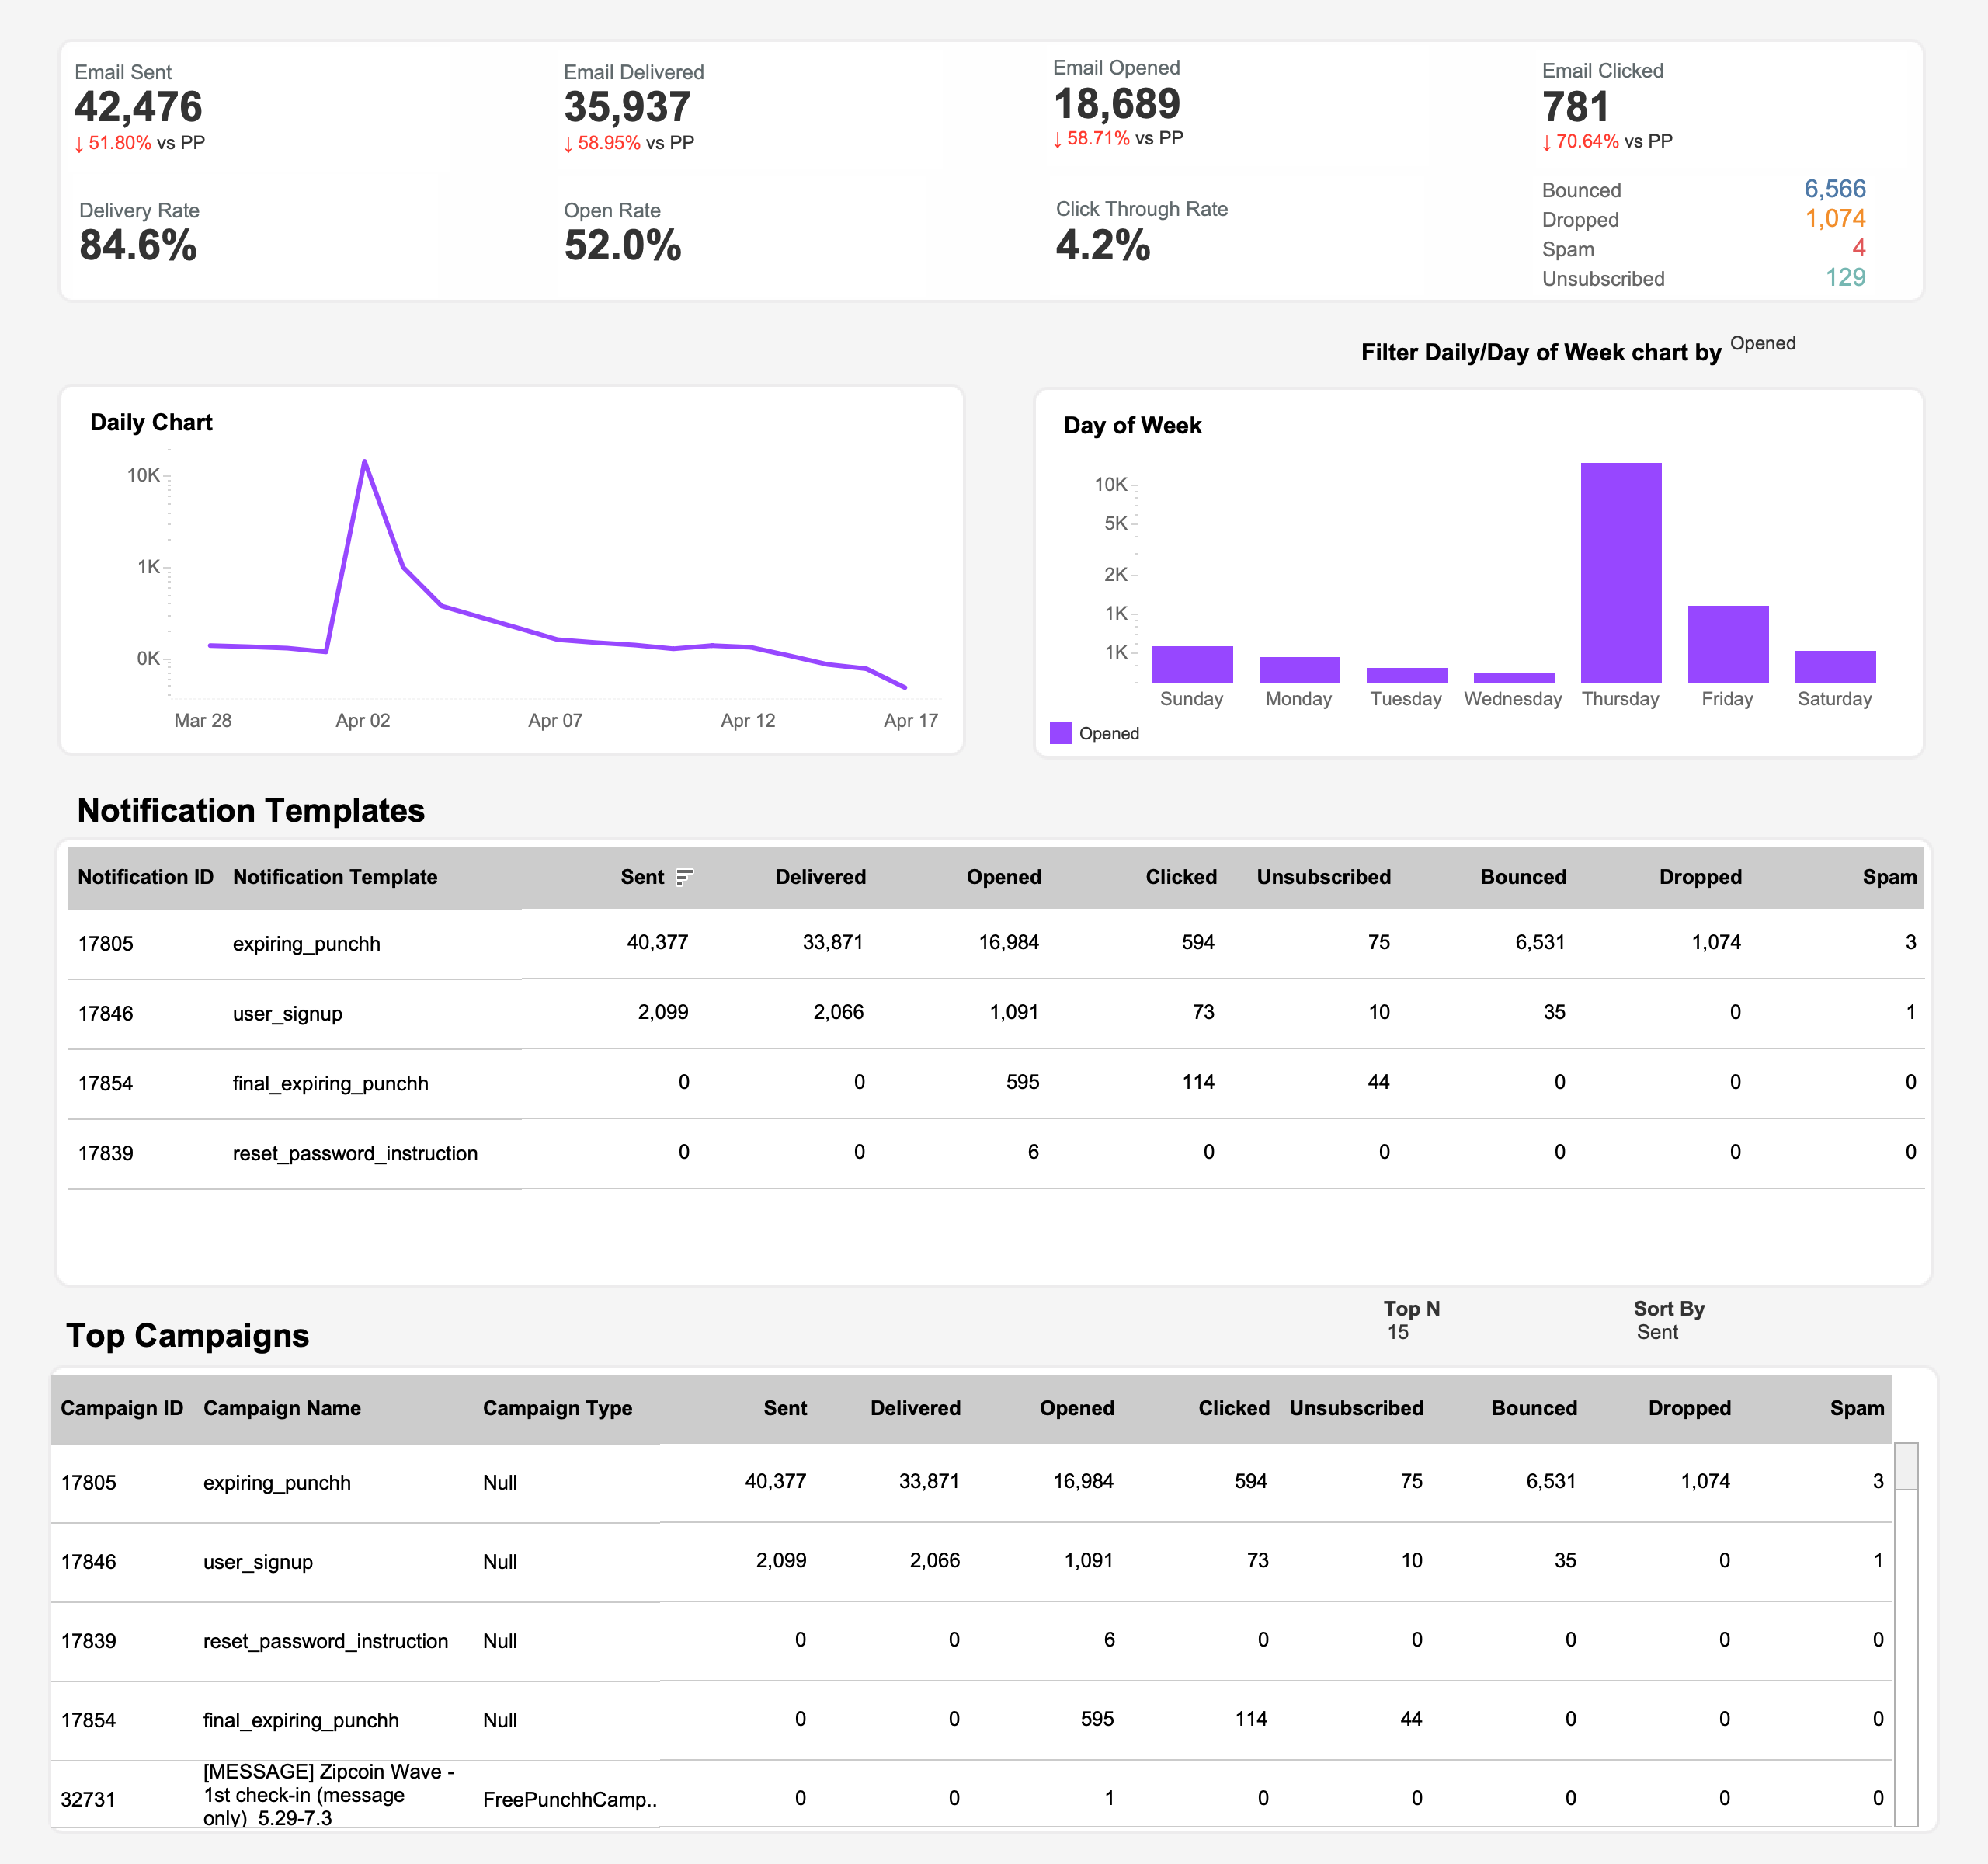
The Email Analytics dashboard is a daily aggregation of email events that displays key metrics for the given period selected.
The dashboard provides:
- Overall statistics of key email metrics.
- Time series graph showing daily and day-of-week trends; adjustable to the time frame selected.
- New module displaying email metrics for Notification Templates (now called System Messages in the platform).
Punchh processes and cleanses your email data utilizing the SendGrid Events Webhook to provide you with the most accurate data. The volume of data includes all applicable campaign and transactional emails sent using the Punchh platform.
To view the Campaign Analytics Dashboard, navigate to Marketing Automation > Email Analytics
Dashboard Terms and Definitions
| Term/Metric | Definition |
|---|---|
| Bounce | Total count of emails bounced due to incorrect email address details. If a server cannot or will not deliver a message, SendGrid fires a bounce event. Bounces often are caused by outdated or incorrectly entered email addresses. Often times you won't know a bounced email address until it bounces, so this event can help you ensure it doesn't bounce again by removing it from your lists. |
| CTR | Total number of emails clicked / Total number of emails opened |
| Daily Chart | Graphical representation of all the events at a daily level. The line graph is smoothed using a logarithmic representation of the data. |
| Date Range | Set a Date Range and metrics will adjust to that date range selection for all modules on this dashboard. Default is to display the last 30 days. |
| Day Of Week Breakdown | Graphical representation of the events on a day-of-the-week graph. This graph is meant to help glean insights into how your guests interact on different days. Note: The same filter of email events selected in the daily chart applies. |
| Delivery Rate | Percentage of emails delivered out of total number of emails processed. |
| Dropped | Total count of emails not sent to a recipient for delivery due to a spam checker, an unsubscribed user, etc. There are a number of reasons your email will not even be sent to a recipient for delivery. This event informs your system when an email has been dropped. Further, it provides a reason for the drop, such as if we've found spam content (if spam checker app is enabled) or we see the recipient has unsubscribed previously. |
| Email Sent | Total number of emails sent in the selected duration. This event fires when SendGrid receives an individual message and prepares it to be delivered. Think of this as the top of the funnel unless it is dropped. Each email message you push to SendGrid will create a processed event. |
| Email Delivered | Total number of emails delivered in the selected duration. When an email has been accepted at the receiving server, the delivered event fires. This event does not guarantee that the email was placed in the recipient's inbox. In fact, a delivered email is only the beginning of an opaque process. The remaining four events begin to give us hints about whether anyone will ever see this delivered email. |
| Email Open | Total number of emails opened in the selected duration. An opened email is the first step toward the action you want your recipient to take. This event fires every time your email is viewed with images turned on. Like all email service providers, SendGrid uses a transparent image beacon to track opened messages. This beacon is currently the only way a sender can tell if an email has been opened. |
| Email Clicked | Total number of emails where the message link was clicked in selected duration. The click is the pinnacle of email engagement! Your call to action, whether it is to confirm a newly registered account or to view a recommended product, asks the recipient to click a link. SendGrid tracks that interaction and fires a click event. |
| Filters | You can select and deselect which event types are included using the dropdown to filter email events. |
| Notification Templates (now called System Messages in the platform) |
Tabular representation of all the notification templates through which an email is sent to guests in the selected date range. Data is sorted by the number of emails processed. |
| Open rate | Percentage of emails that are opened out of total number of emails delivered in selected duration. |
| Spam | Total count of emails reported as spam. Most Internet Service Providers (ISPs) provide a feedback loop, sending specific spam complaints to Email Service Providers (ESPs), like SendGrid. When SendGrid receives a notice, we fire a spam event, so that you can react appropriately--or at the very least, never send another email to that address! |
| Top 5 Campaigns | Tabular representation of the top 5 campaigns based on the number of emails processed via campaigns. |
| Unsubscribe | Total count of emails where the user selected to unsubscribe. One of the most important events fires when a recipient unsubscribes from your mailings. Reacting immediately to an unsubscribe by removing the email from your lists can pay long-term dividends in fewer spam reports and a higher engagement rate. |