Home
Dashboard
When you log in as a non-Admin user, you are taken to the Home > Dashboard screen.
Dashboard (example)
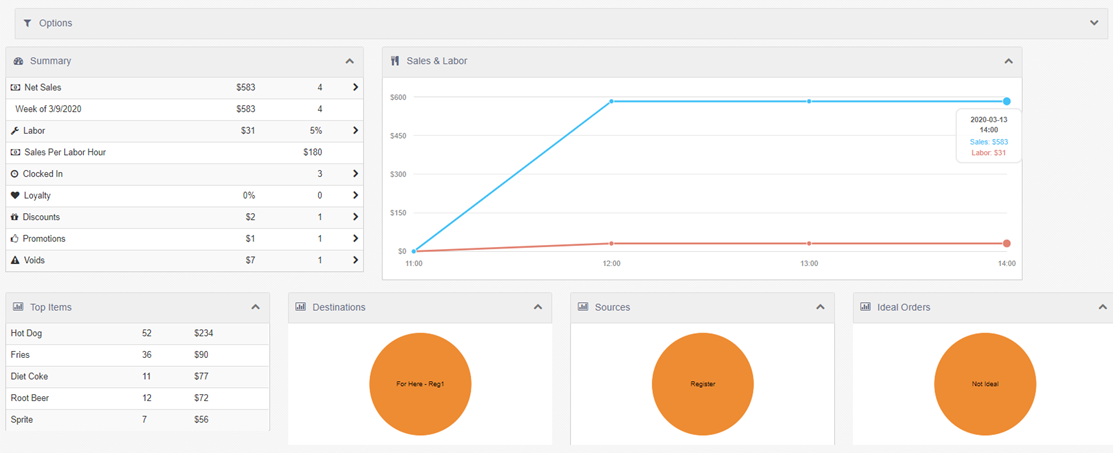
The Dashboard page displays data elements in widget format for the selected locations and date range. You can use the dashboard controls in Options on the top of the page to change the locations, date and widgets that are displayed on the dashboard.
Options

Dashboard controls

The controls, from left to right, are:
-
'Locations': Clicking the control opens the Locations dialog. Using the drop-down list, you can select All Locations, Select Locations, All Groups, or Select Groups.
NOTE: All Groups and Select Groups will only appear if you have Location Groups configured. See Location Groups.
-
'Date': Clicking the control opens the Date dialog. Using the drop-down list, you can select Date Range, Day, Week, Month, or Pay Period.
-
'Ownership Type': Clicking the control opens the Ownership Type dialog. Using the drop-down list, you can select All Ownership Types, Corporate, or Franchisee.
-
'Widgets': Clicking the control opens the Widget Configuration dialog. See Widget Configuration for details.
NOTE: The default dashboard widgets are Summary, Sales & Labor, Top Items, Destinations, Sources, and Ideal Orders.
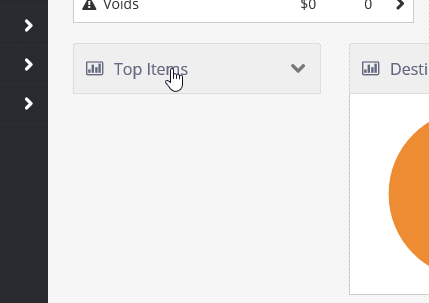
Individual widgets on the dashboard can be collapsed and expanded by clicking their title bars.
Collapsed Top Items widget
Widget Configuration
Clicking the 'Widgets' button in the upper right corner opens the Widget Configuration dialog.
Widget Configuration dialog
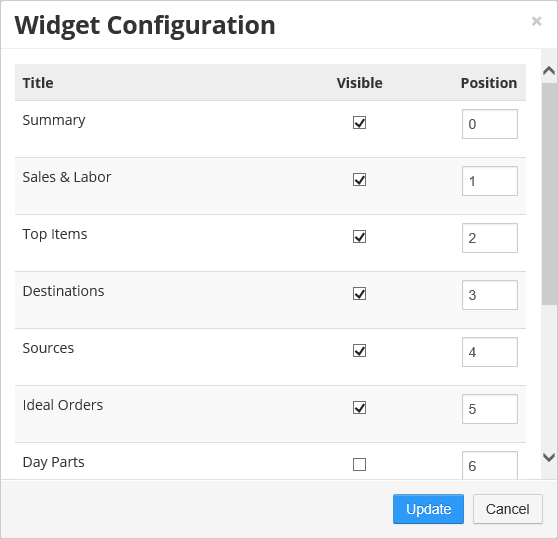
All available data widgets are shown in the list. Those with their Visible check boxes checked are displayed on the dashboard. The order in which they are displayed is controlled by the value of their Position field, from lowest (0) to highest (up to 10).
The available widgets are:
-
Summary: Displays key metrics in list format, including Net Sales, Labor cost, Sales Per Labor Hour, the number of employees Clocked In, and the number and amounts of Discounts, Promotions, and Voids.
Summary widget
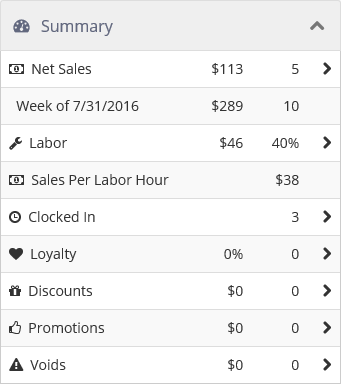
Each item that has an arrow next to it can be clicked to go to a details page that displays additional information organized by location.
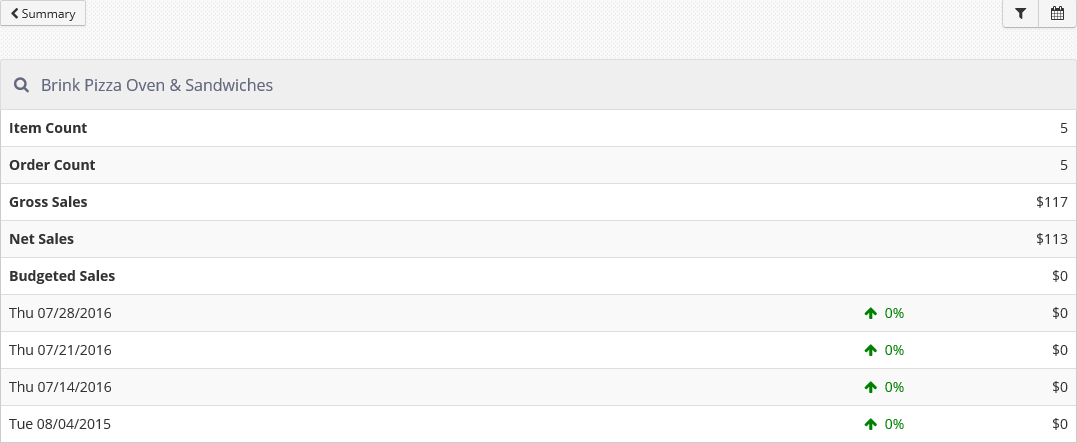
Sales summary, accessed by clicking Net Sales in the Summary widget

A location can in turn be clicked to access even more detailed information.
Location sales details, accessed by clicking the location in the sales summary
-
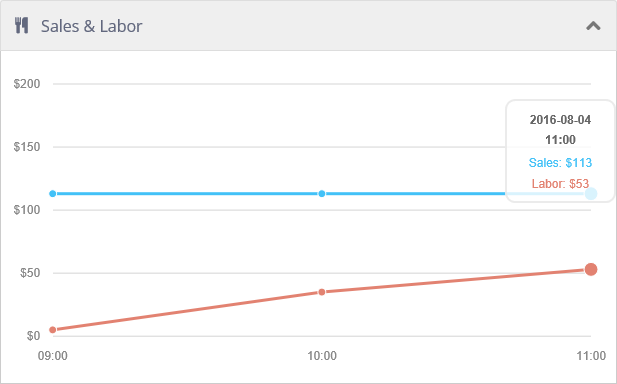
Sales & Labor: Displays a line graph with the net sales and total labor cost for the selected date range plotted. If the dashboard is displaying data for a single day, the graph is delineated by hour; if the dashboard is displaying data for more than one day, the graph is delineated by date.
Sales & Labor widget
-
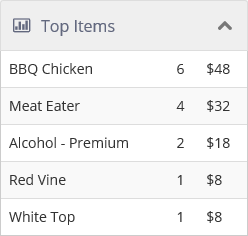
Top Items: Displays the five items that have generated the highest total sales for the selected date range. In addition, a count of items sold for each is shown.
Top Items widget
-
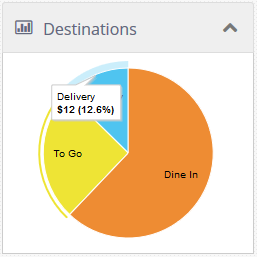
Destinations: Displays a pie chart of the distribution of sales by destination. Moving the cursor over any part of the pie chart displays net sales and percent of total net sales for that destination.
Destinations widget
-
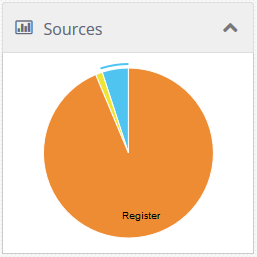
Sources: Displays a pie chart of the distribution of sales by the order source: Register, Customer Portal, or Mobile. Moving the cursor over any part of the pie chart displays net sales and percent of total net sales for that source.
Sources widget
-
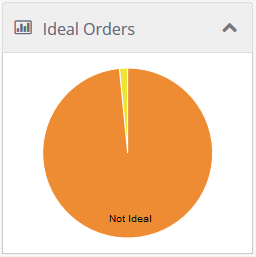
Ideal Orders: Displays a pie chart of the distribution of orders that match the ideal order definition. Ideal orders are defined on the Options > Ordering > Ideal Order tab in Settings Editor (see Ideal Order). Moving the cursor over any part of the pie chart displays net sales and percent of total net sales for that part.
Ideal Orders widget
-
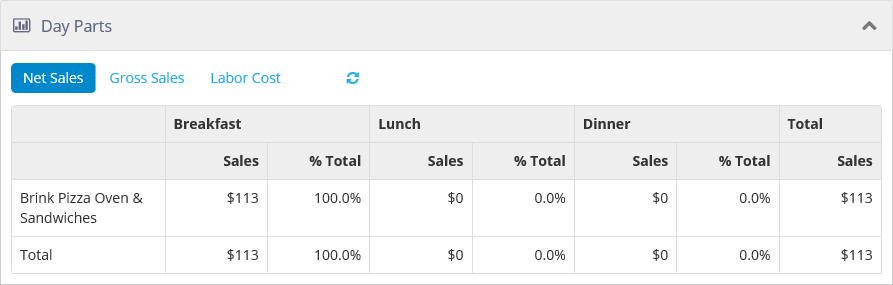
Day Parts: Displays Net Sales, Gross Sales, or Labor Cost by day part for each of the selected locations. Click the buttons to display the corresponding data. Click the 'Refresh' button to refresh the data.
Day Parts widget
-
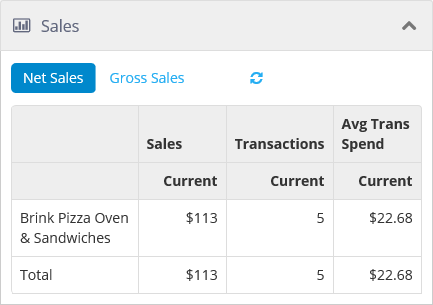
Sales: Displays Net Sales or Gross Sales for each of the selected locations. Also displays the number of transactions and the average amount spent per transaction. Click the buttons to display the corresponding data. Click the 'Refresh' button to refresh the data.
Sales widget
-
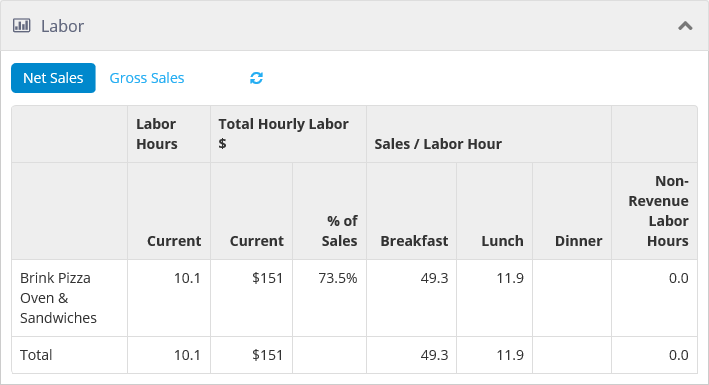
Labor: Displays labor statistics and how they relate to sales by day part for each of the selected locations. Click Net Sales or Gross Sales to display the corresponding data. Click the 'Refresh' button to refresh the data.
Labor widget
-
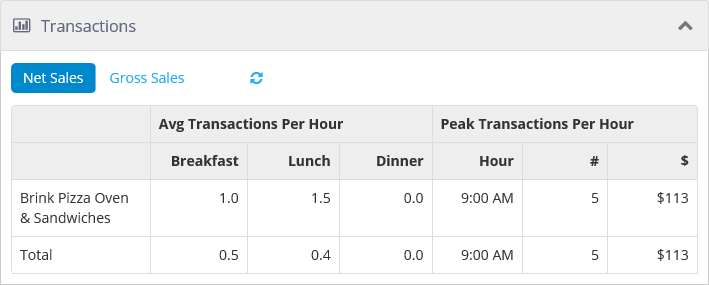
Transactions: Displays the average number of orders per hour by day part for each of the selected locations. Click Net Sales or Gross Sales to display the corresponding data. Click the 'Refresh' button to refresh the data.
Transactions widget
-
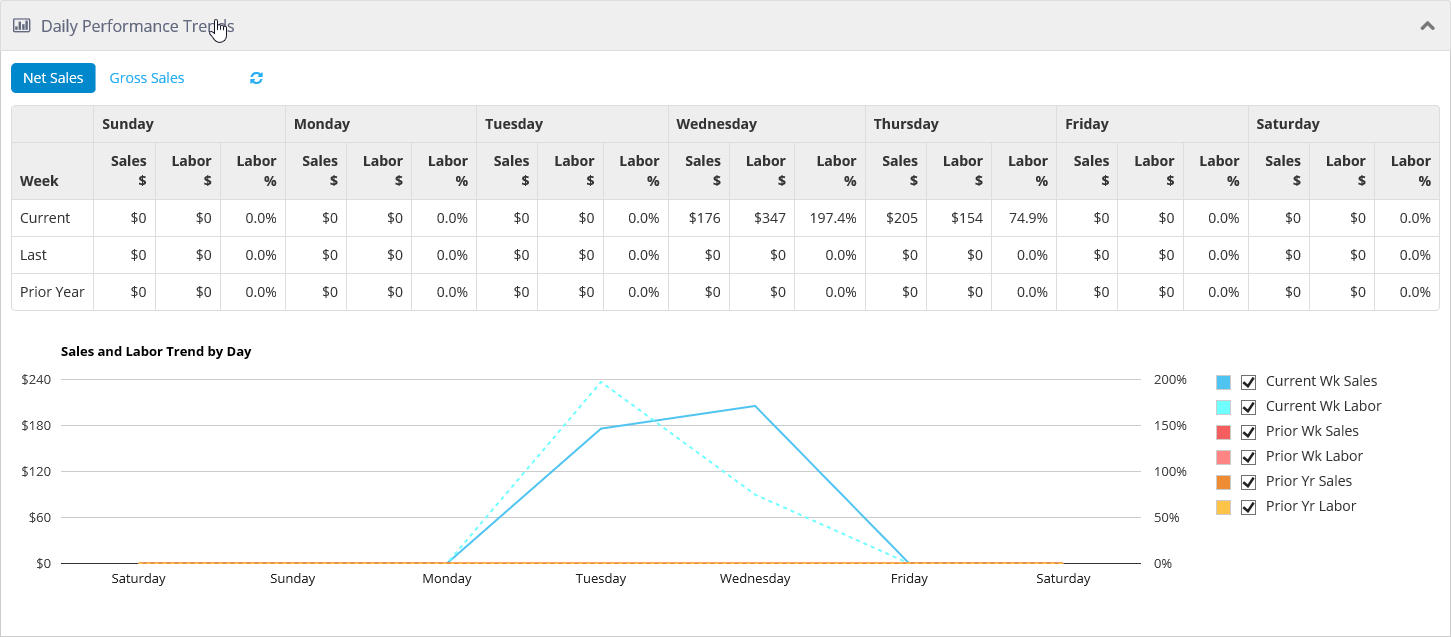
Daily Performance Trends: Displays line graphs of sales and labor values by the day of the week. Click Net Sales or Gross Sales to display the corresponding data. Click the 'Refresh' button to refresh the data. Select or deselect the check boxes to display the corresponding current or historical data.
Daily Performance Trends widget
Devices
The Devices page displays the connection status for all Kitchen Displays and Registers for the selected location. The location's current business date is shown at the top of the Registers section. Along with the Terminal Topology, which is the configuration of the terminal e.g. IP Address, Machine ID.
Terminal Topology also controls the In-Store Resilience feature (5.0m+), allowing the user to select a backup primary register in the case of network connectivity/internet loss. Please see the In-Store Resilience Release Notes for information regarding use and configuration.
The status of the Maintenance Service for each Register and Kitchen Display is reported in the Maint. Svc. Status column.
The page also displays all Cash Drawers, to whom they are checked out, and the amount of cash in each. The total amount of cash in all drawers displays at the top of this section.
Also, the ability to change a locations environment for lab\demo\staging purposes. The Change Environment Type to: No Registers is shown at the upper right top of the page
Devices page (example)
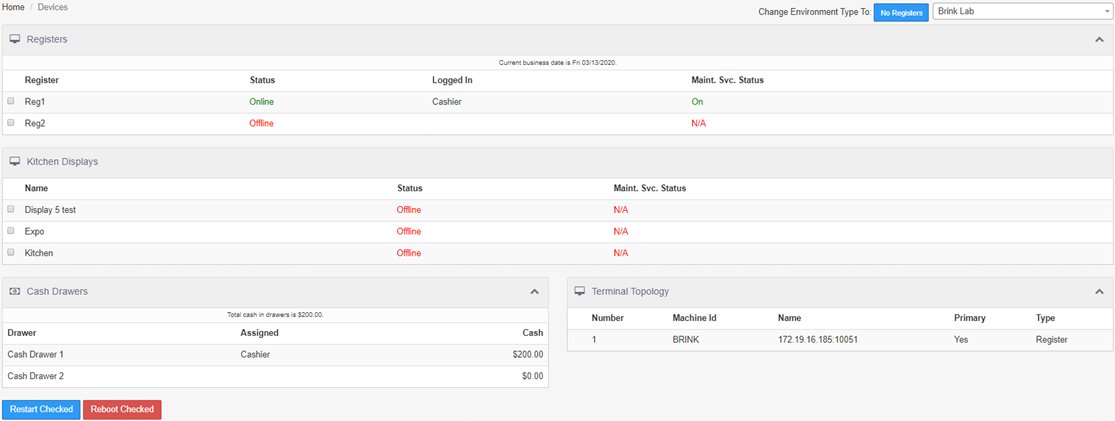
Registers and kitchen displays can be restarted (the software closed and reopened) or rebooted (the hardware powered off briefly and then back on) by checking the device's check box and clicking the appropriate button: Restart Checked or Reboot Checked.