Product Mix by Item Group Report
The Product Mix by Item Group Report displays sales totals for item groups during a given reporting period. The report is run on the Admin Portal by going to the Reports screen, selecting Product Mix, and then selecting By Item Group.
NOTE: In order to run this report, you must have at least one Item Group defined in Settings Editor with at least one item in it.
Report Options
The Product Mix by Item Group Report is highly configurable. In addition to location and time period, the level of detail and specific items or item groups can be selected.
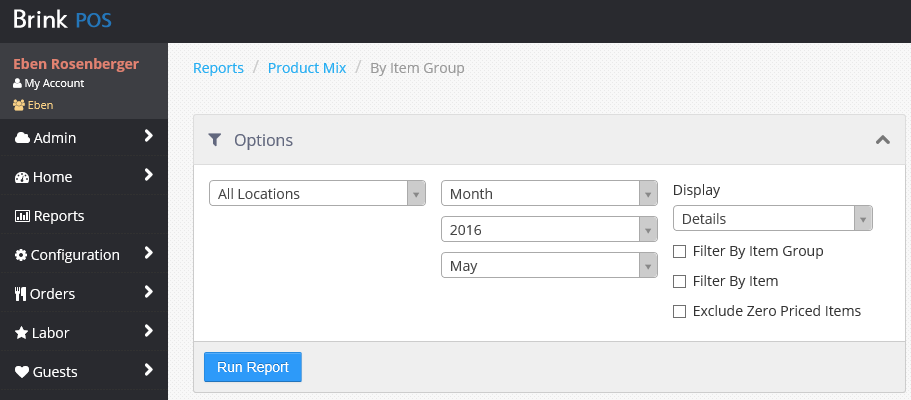
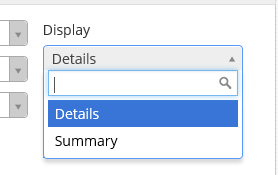
Detail Level
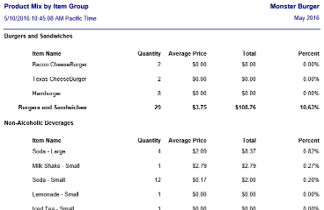
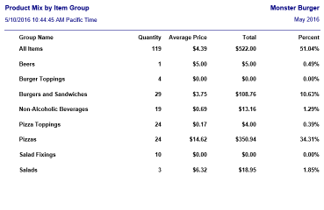
The Display drop-down list controls the level of detail that is shown in the report. If Details is selected, then the report displays statistics for each item within each item group. If Summary is selected, then the report displays only totals for each item group.
Product Mix by Item Group report, Details (left) and Summary (right)
Filter by Item Group or by Item
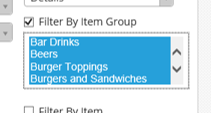
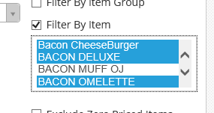
Checking the Filter By Item Group check box or the Filter By Item check box allows you to narrow the scope of the report to specific item groups or items. The lists allow multiple selections. Select a range by Shift-clicking. Select multiple individual items in the list by Ctrl-clicking.
Filtering by Item Group and by Item
You can also exclude items that have a price of $0.00 from the report by checking the Exclude Zero Priced Items check box.
Item Descriptions, Detailed Reports
| Item | Description |
|---|---|
| Group Name | The group name is listed on the far left. Items within the group are listed below, indented. A total for each column is displayed at the bottom of each group. |
| Item Name | Displays the name of each item within the item group. |
| Quantity | Displays the number of each item sold during the reporting period, with a total at the bottom. |
| Average Price | Total ÷ Quantity |
| Total | Displays the total sales (before tax) in dollars for each item within the item group for the reporting period, with at grand total at the bottom. NOTE: The sales tallied in this column do not reflect any discounts or promotions applied to the items when purchased. |
| Percent | Total ÷ sum of Totals for all Item Groups × 100. |
Item Descriptions, Summary Reports
| Item | Description |
|---|---|
| Group Name | Displays the name of each group included in the report. |
| Quantity | Displays the total number of items in the item group that were sold during the reporting period. |
| Average Price | Total ÷ Quantity |
| Total | Displays the total sales (before tax) in dollars for all items in the item group for the reporting period. NOTE: The sales tallied in this column do not reflect any discounts or promotions applied to the items when purchased. |
| Percent | Total ÷ sum of Totals for all Item Groups × 100. |