Dashboard
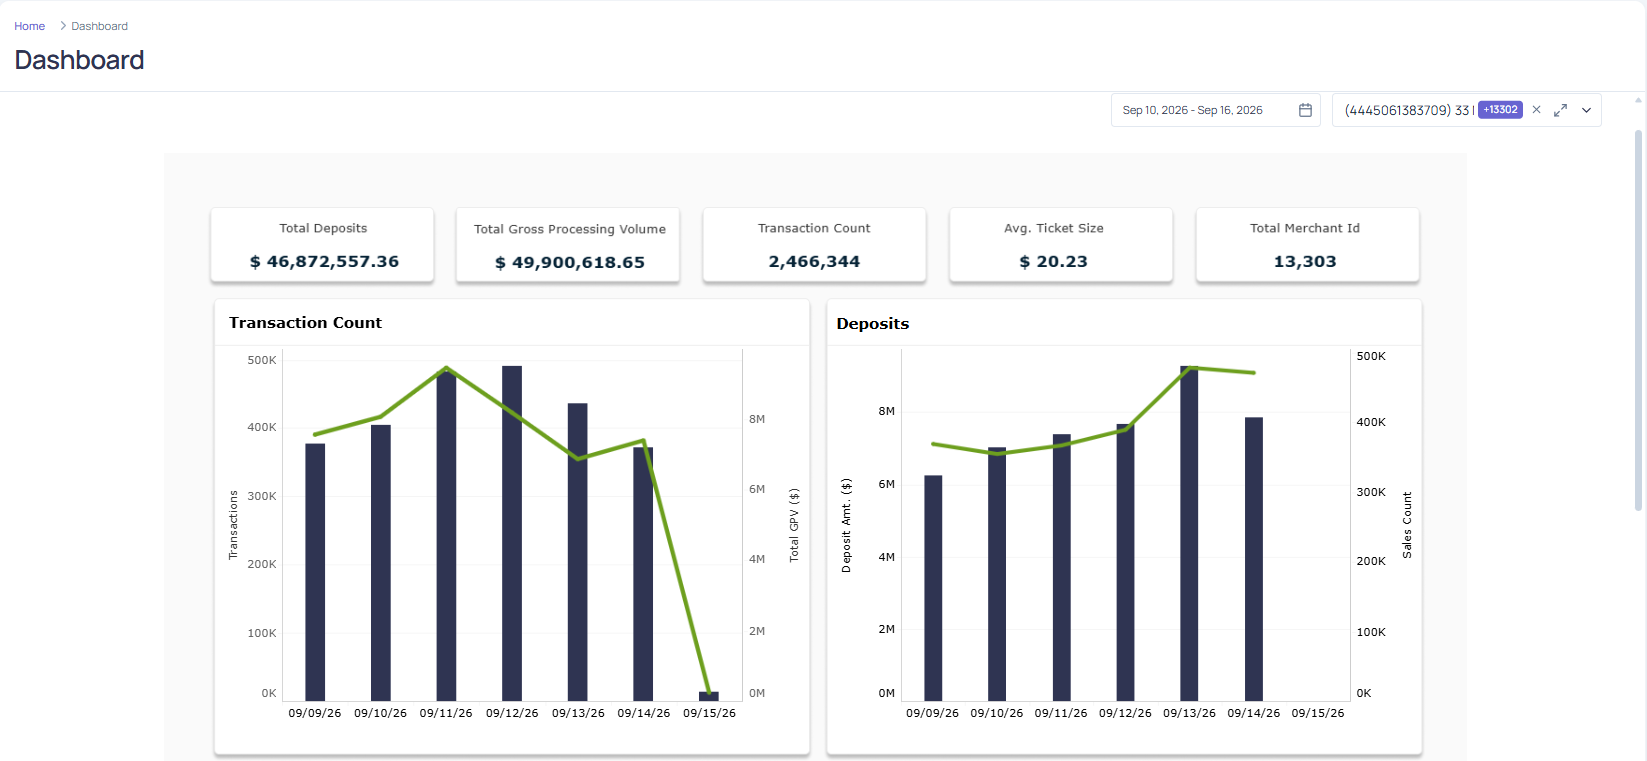
The Dashboard provides users with a centralized view of merchant payment activity and performance metrics. It is designed to support operational monitoring, financial analysis, and decision-making.
Filtering Options
Users can customize the data displayed using the following filters:
- Date Range: Select a specific time period to view historical or recent data.
- Merchants: Filter results by individual merchants or merchant groups.

Expanded Merchant View
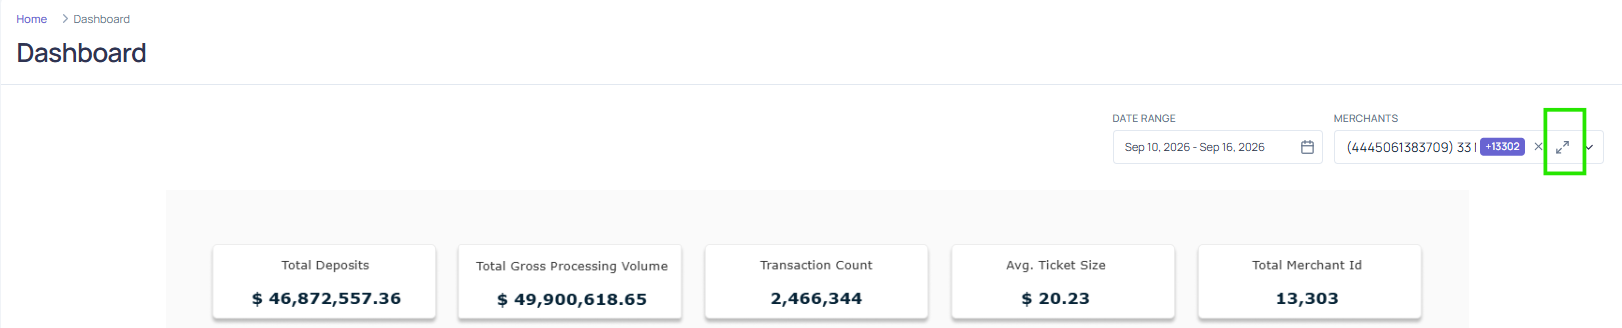
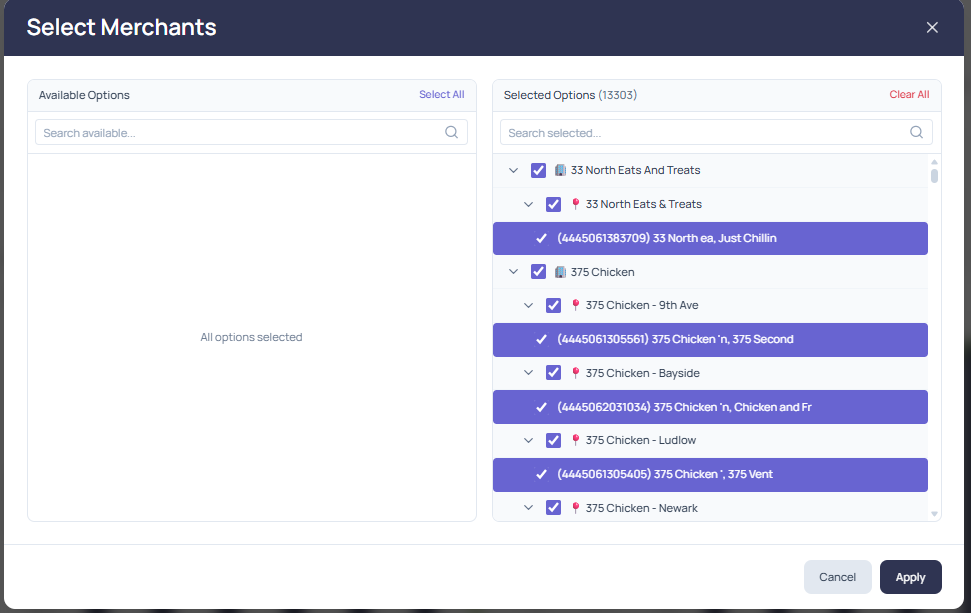
The Merchants filter includes an expand icon to the right of the selected-merchants field. Click this icon to open the full-screen Select Merchants view, which makes it easier to browse, search, and manage large merchant selections.
The Select Merchants dialog uses a dual-panel layout with a hierarchical (tree) structure:
- Available Options (left panel): Lists all merchants not yet selected. When every merchant is chosen, this panel shows All options selected. Use Search available… to filter the list, or Select All to move all merchants into the Selected panel.
- Selected Options (right panel): Lists all currently selected merchants, with a running count shown in the header (for example, Selected Options (13303)). Use Search selected… to filter the current selection, or Clear All to deselect every merchant.
Hierarchy Levels
The tree is organized into three expandable levels, each toggled using the chevron control:
- Business / Brand: The top-level grouping, shown with a folder icon (for example, 375 Chicken).
- Location Group: A grouping of merchants by location, shown with a pin icon (for example, 375 Chicken – 9th Ave).
- Merchant / MID: An individual merchant, shown with its Merchant ID in parentheses (for example, (4445061305561) 375 Chicken 'n, 375 Second).
Selecting Merchants
- Use the checkboxes to select or deselect merchants at any level. Selecting a parent automatically selects all merchants beneath it.
- Selected merchants appear as highlighted rows with a checkmark.
- Expand any parent node to view and adjust its child merchants.
Applying Changes
- Apply: Saves your selection and closes the dialog.
- Cancel: Discards changes and closes the dialog without saving.
Displayed Metrics
The dashboard highlights key performance indicators, including:
- Total Deposits: The cumulative amount of funds deposited to merchants.
- Total Gross Processing Volume (GPV): The total value of all processed transactions.
- Transaction Count: The number of transactions processed during the selected period.
- Average Ticket Size: The average value per transaction.
- Total MIDs: The number of active Merchant IDs represented in the data.

Visual Charts
The dashboard includes four interactive charts for deeper insights:
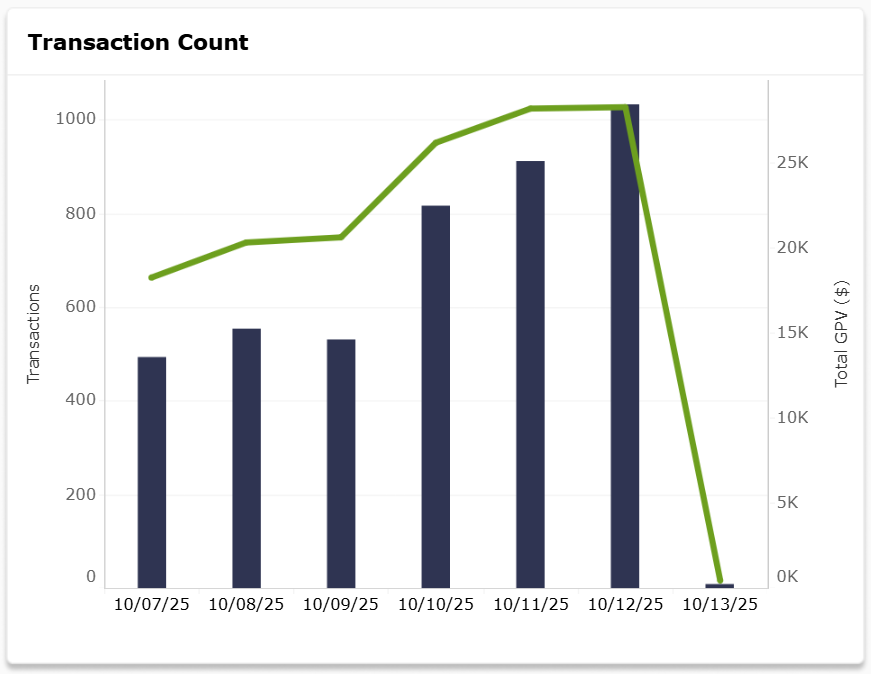
- Transaction Count Over Time: Displays trends in transaction volume.
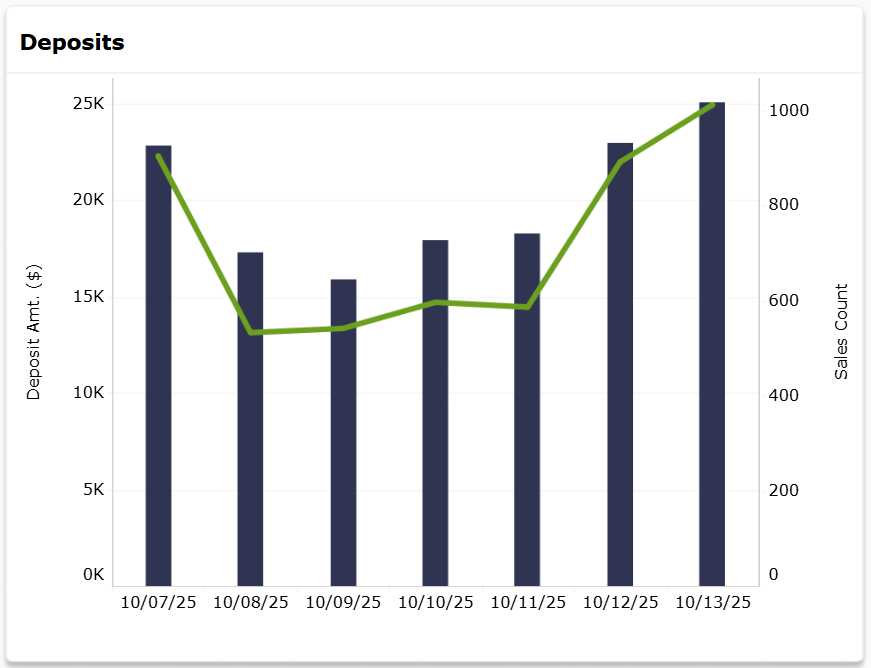
- Deposits Over Time: Visualizes deposit activity across the selected period.
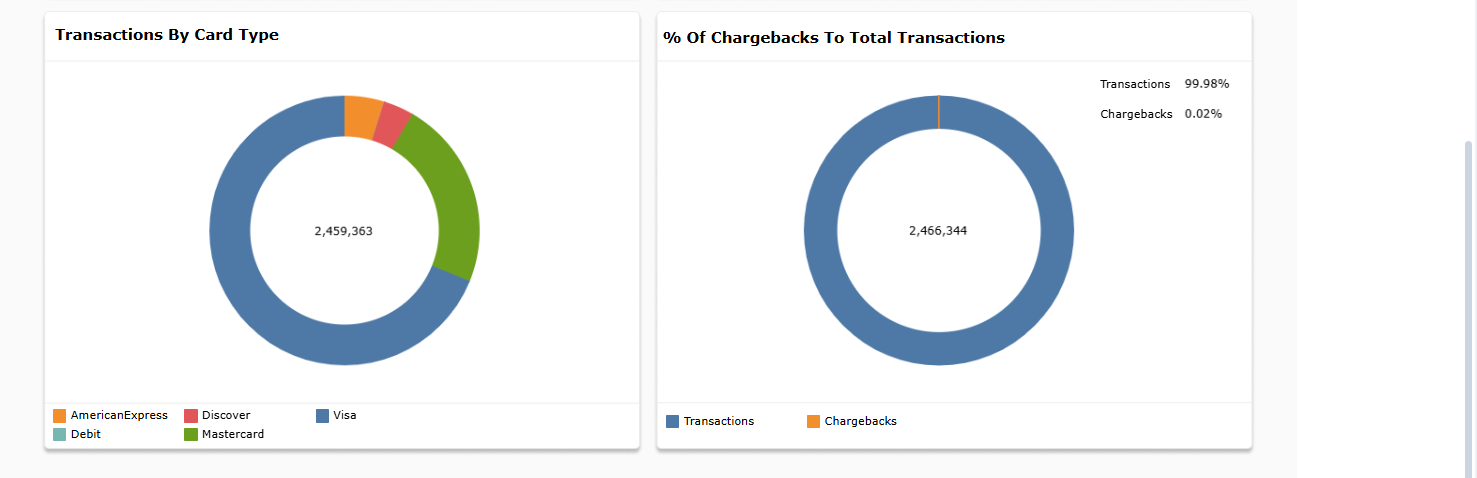
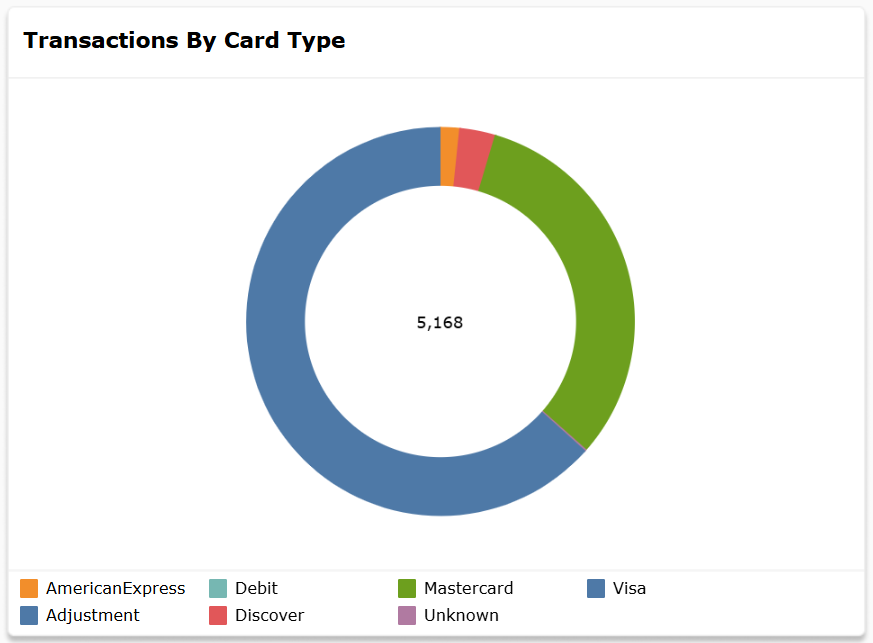
- Transactions by Card Type: Breaks down transactions by card brand (for example, Visa, Mastercard).
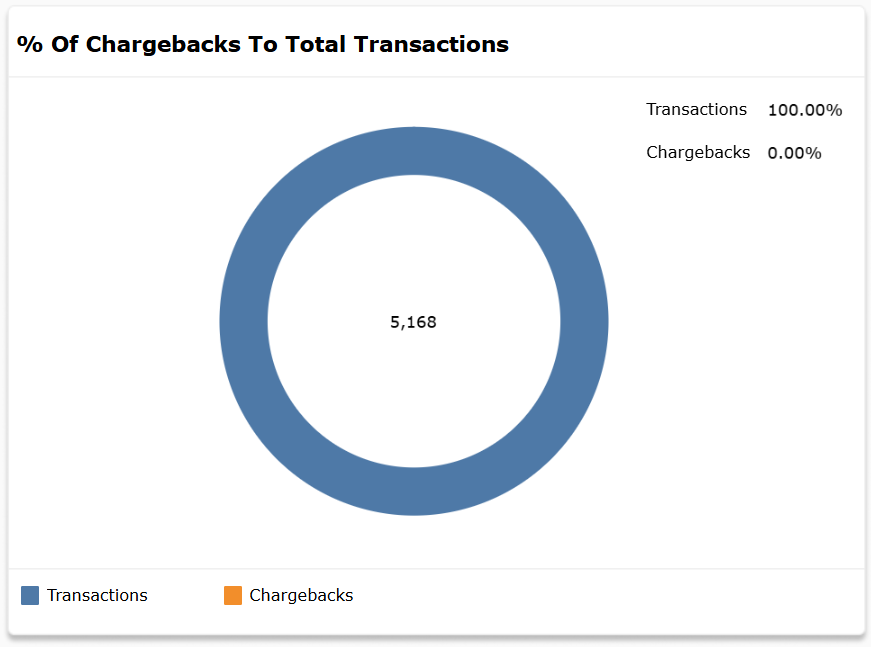
- Chargeback Ratio: Shows the percentage of chargebacks relative to total transactions.