PAR Link Performance Dashboard
Context
PAR Link Performance Dashboard is is our first reporting dashboard specifically focused on External Channels.
What does it show?
It shows statistics related to Orders made via External Channels.
How does it work?
Here's a breakdown of this feature:
Security
The dashboard has a row level security applied - this controls data segmentation.
Data refresh
The data updates live, with a presumed lag of 15 minutes.
Filters

- Store groups
This filter allows you to select a Store Group which will display data for all of the Stores which sit inside the Store Group. This allows you to quickly filter data down to a set of Stores. You will only see a list of the Store Groups which you have access to within the Management Center - Stores
Store filter allows you to select one Store or particular multiple Stores - Store code
Store Code filter allows you to select a Store or multiple Stores by referencing a Brand's internal Store coding system, This will filter down the data just to these set Store(s) - External channels
This one lets you select particular Channels you'd like to focus on -
Timeframe
This one allows you to define the timeframe for which you want to look at the data - it is based on the Orders created at that certain time. By default this is set to 'Last week'. You can either select a predefined option or provide a custom range: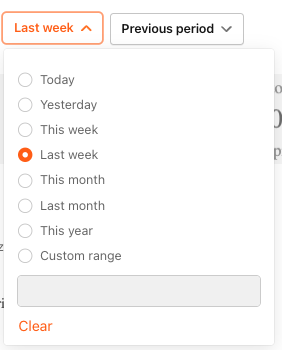
-
Comparison
The comparison allows you to define the timeframe for which you want to compare your current data with a comparison period - it is based on the Orders created at a certain time. By default this is set to 'Previous period'. You can either select a predefined option or provide a custom range: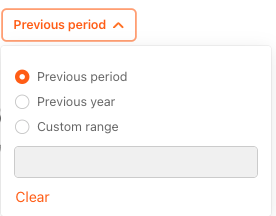
Views
Headline KPIs
- The headline KPIs provides a high-level summary
-
The KPIs show the number of Orders, and and percentage (%) for the period of time and Store(s) selected within the filters. The view can be changed by using the Unit icon:
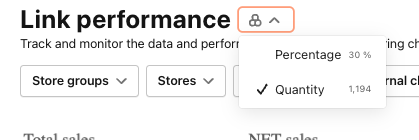
- The KPIs also show the numbers generated for the previous period of time as defined by the previous period filter for the time period and Store(s) defined within the filters
-
It also shows the delta between the previous and current KPIs

Offline Stores
This element shows a pie chart of all Stores that are offline per External Channels.
High level overview
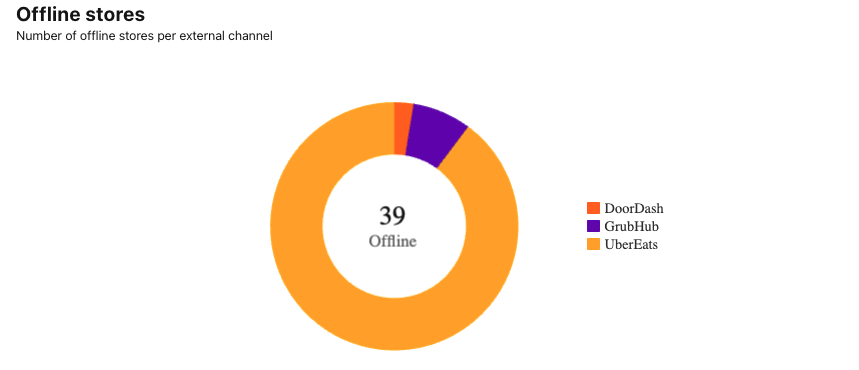
Drill-down
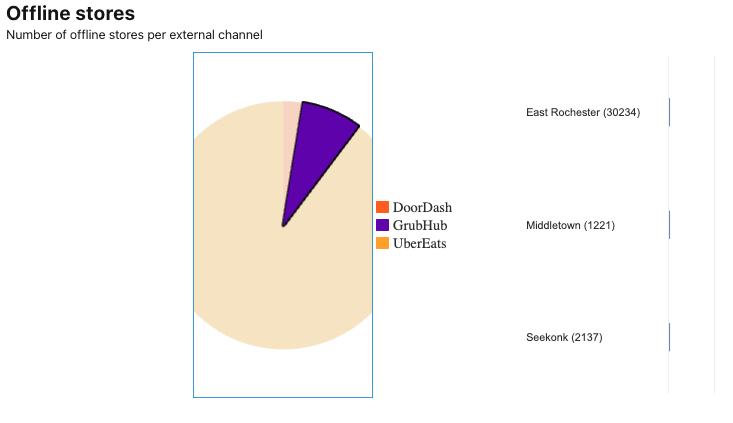
- You can select on an Aggregator to update the table of impacted Stores
- You can return back up the hierarchy level by selecting the pie chart
Download data
- You can download the raw data behind the KPIs and charts and graphs based on the filters defined. The data is downloaded in a CSV format
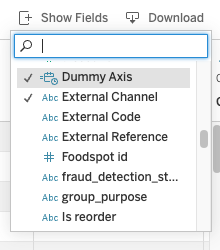
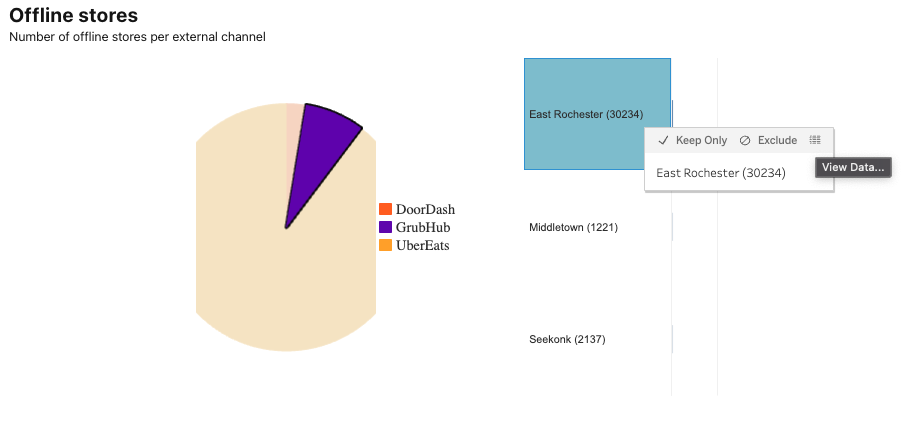
- You may also select a data point to see the raw data in a new pop-up. Apart from that, there's also an option to edit the downloadable data by selecting additional data points of your choice
Data behind the data point
Data overview
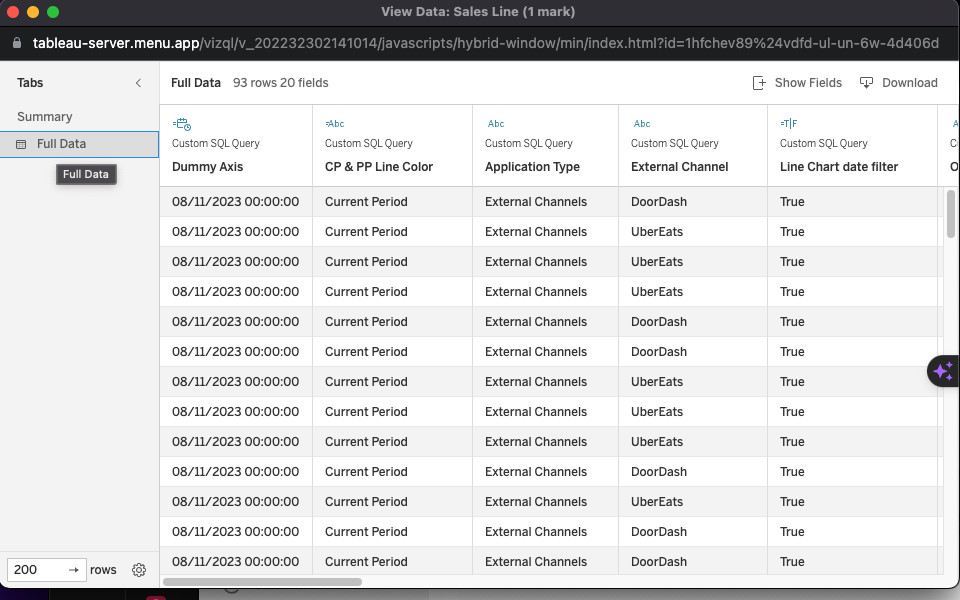
Additional data points and download