Monitoring and Alerting - Data Pipeline
Context
We have designed multiple monitoring and alerting systems so that the customer and support team is aware of any issues that arise in the pipeline. Below is a list of monitoring/alerting activities performed.
-
The monitoring screen in the UI
-
This provides high level statistics
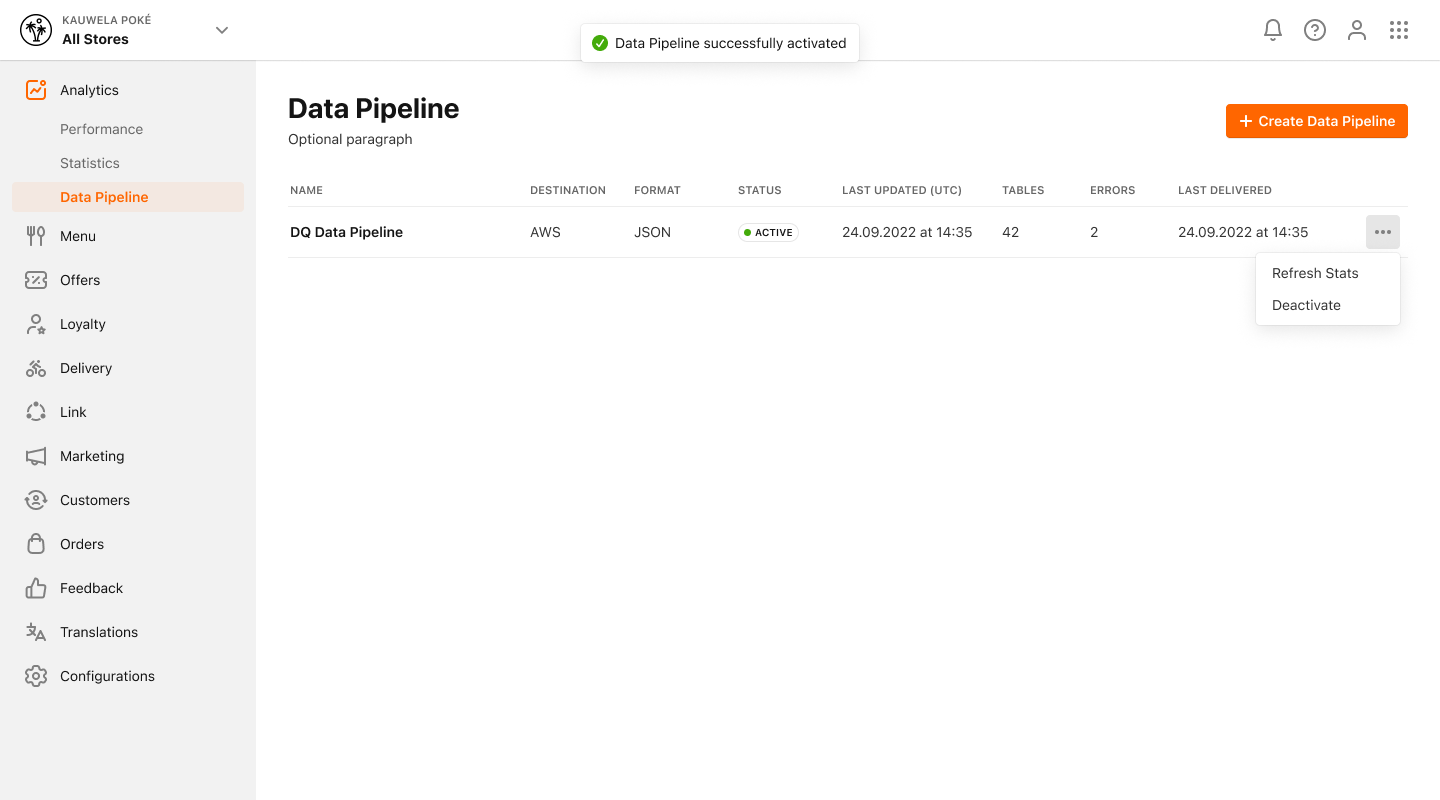
- number of tables with errors
- last delivered date time
-
Detailed statistics
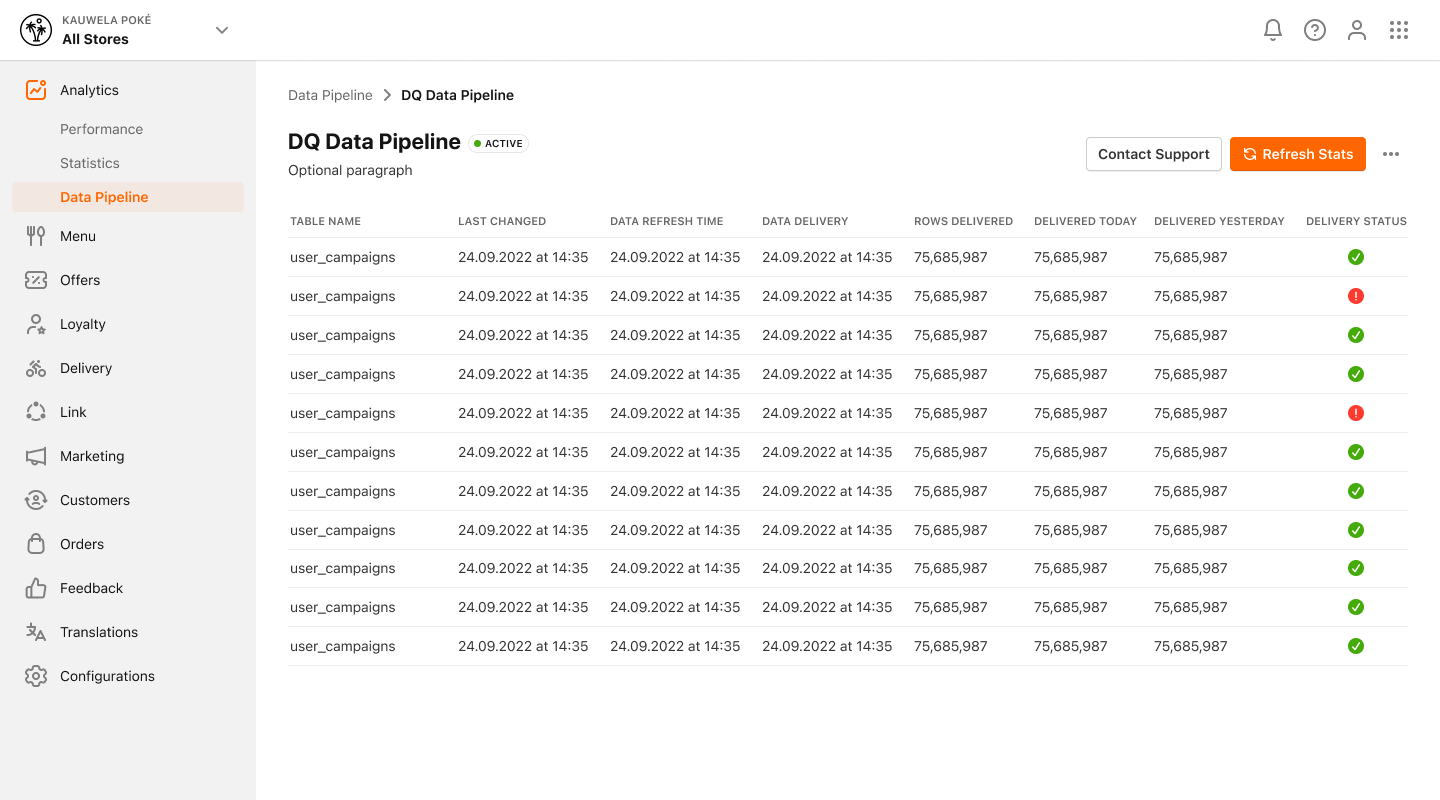
- Table last changed date (Column name - TABLE MODIFIED; Display date only. Hover text - Table definition was last changed on this date)
- Latest data refresh timestamp from production to replica (Column name - SOURCE DATA CAPTURED ; Display datetimestamp. Hover text - Data was captured/created on MENU server (source for data pipeline) at this date-time)
- Latest timestamp at which data was delivered to the customer from replica (Column name - LAST DELIVERY; Display datetimestamp. Hover text - Data was last delivered to the destination at this date-time)
- Number of rows delivered to the target destination as of the latest delivery (Column name - ROW - LAST DELIVERY; Display int. Hover text - Number of rows of data delivered to the destination as of last delivery)
- Total number of rows delivered today / Current day count (Column name - ROWS - TODAY; Display int. Hover text - Number of rows of data delivered to the destination today)
- Total number of rows delivered yesterday (Column name - ROWS - YESTERDAY; Display int. Hover text - Number of rows of data delivered to the destination as of the previous day)
- Delivery status of each attempt along with errors (Column name - STATUS ; Display image - green check for success; red exclamation for errors with error description in the hover text. Hover text for column - Status of delivery based on the most recent delivery attempt. Hover text at row level for errors - Display short error description)
-