Transaction Analytics Report
The Transaction Analytics dashboard (Loyalty Program > Transaction Analytics) allows brand marketers to track transaction-related key metrics such as Loyalty Sales, Loyalty Transactions, and Redemptions done by the loyalty users. It provides detailed trends of these KPIs using intuitive visualizations such as heat maps and calendars, breaking them down by hour of the day and day of the week. A unique value of this dashboard is that it allows users to track the Sales-related metrics using either Earnable Amount or Receipt Amount. This capability is the first of its kind on the platform and allows brand marketers a great degree of flexibility in tracking Sales-related metrics.
Brand marketers get to choose the date range/durations and specific locations to focus on and compare metrics between current and past time periods. At any time, you can capture the current Dashboard view by exporting it to PNG, PDF, or PowerPoint.
Note: This dashboard displays data for the past six months
Dashboard Layout
The dashboard is split into two tabs: Loyalty Transactions and Redemptions. You can toggle between these two tabs by just clicking on them. Use the Filters option on the left side panelto pick a date range and location(s) for these tabs.
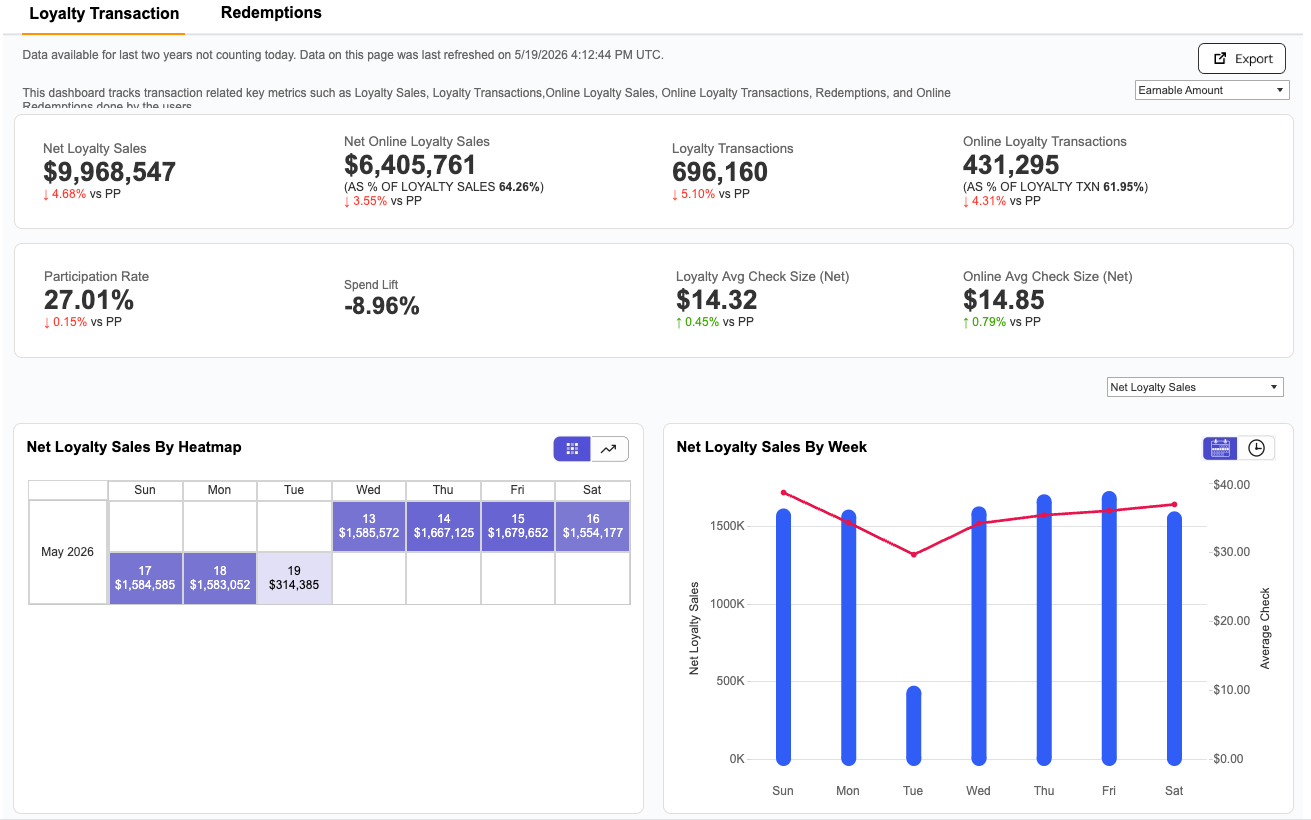
- Loyalty Transactions: Shows high-level metrics such as Net Loyalty Sales, Net Online Loyalty Sales, Participation Rate, Spend Lift, Loyalty Transactions, Online Transactions, Loyalty Average Check Size, and Online Average Check Size and their respective visualization charts.
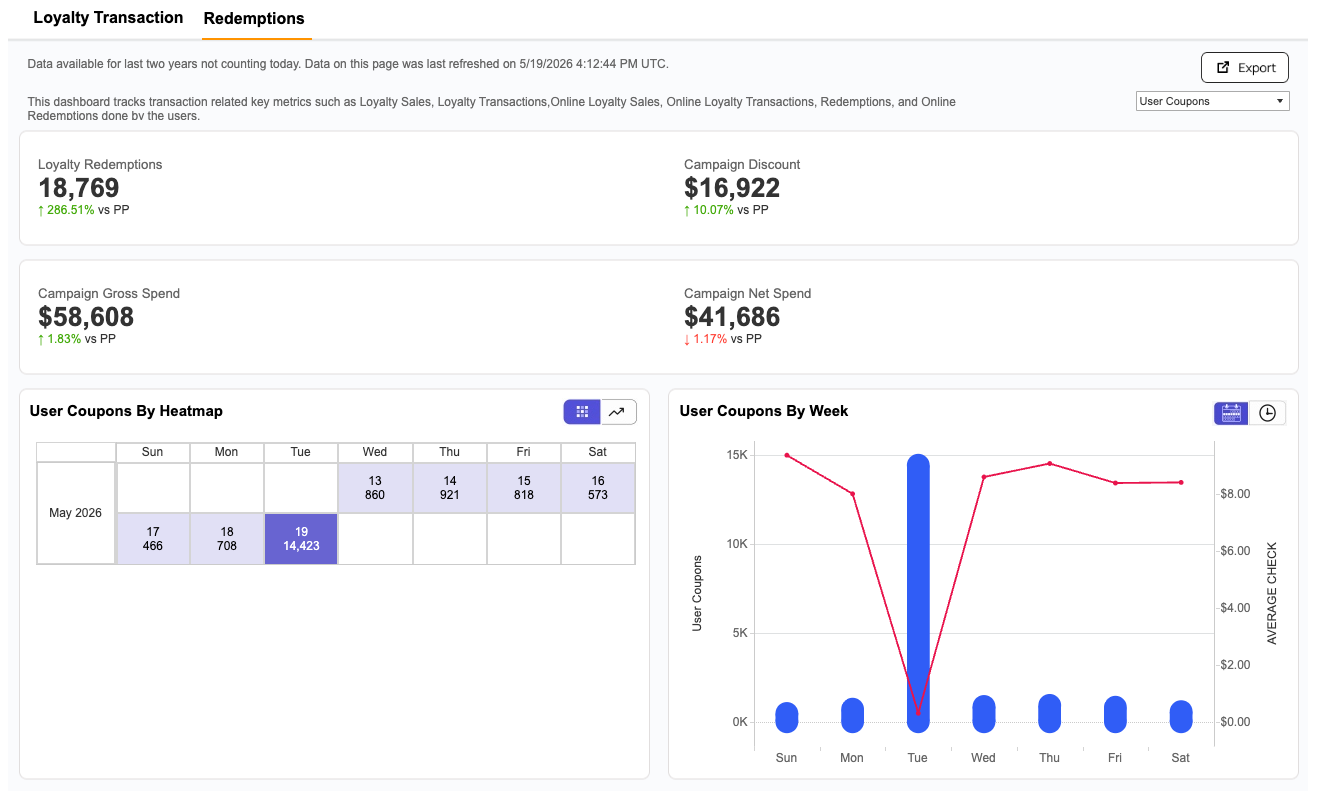
- Redemptions: Shows high-level metrics such as Redemptions, Discount, Gross Spend, Net Spend, Online Redemptions, Online Redemptions Discount, Online Redemptions Gross Spend, Online Redemptions Net Spend and their respective visualization charts.
High-Level Key Metrics - Loyalty Transactions

Time zone: All metrics are shown in business time unless otherwise specified.
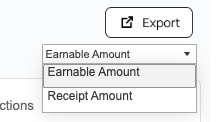
Earnable Amount / Receipt Amount: Allow you to choose to see the metrics based on either Earnable Amount or Receipt Amount as shown above. (By default, the Earnable Amount will be selected at the load of the dashboard.)
Net Loyalty Sales
The total amount of sales generated from the loyalty transactions in the specified duration, based on the Receipt Amount or the Earnable Amount.
Below the metric value, the percentage comparison from the previous period is shown (red indicates a decrease compared to the previous period, and green indicates an increase compared to the previous period). This metric is calculated using the event of checkin.
-
Previous period is defined as the period with exact no.of days as selected preceding the start date. For example, if the Start Date selected is 2022-May-10 and the End Date selected is 2022-May-12, then the previous period is 2022-May-07 to 2022-May-09.
-
Earnable amount is the amount on which a loyalty user is eligible to earn points. Receipt Amount is the Net sales that transpired in the transaction. Earnable amount is calculated after excluding items that are not eligible for earning points on a given transaction. For example, if a business decides to not allow earning of points over alcohol-related purchases, the Earnable amount is calculated after removing the alcohol line items from the transaction.
Net Online Loyalty Sales
The total amount of net sales generated from the online loyalty transactions in the specified duration, based on either the Receipt Amount or the Earnable amount.
The percentage comparison from the previous period is also shown below the metric value. This metric is calculated using the event of checkin.
Participation Rate
Percentage of Loyalty Transactions within the Total Transactions for the given date range (based on the actual transaction date).
Determined by the following formula:
(total loyalty receipts)/(total receipts in t**he POS) x 100
Note: If a guest belonging to your loyalty program visits a store but doesn't check in, they are not counted toward the loyalty receipt total. To ensure outliers don't skew the data, locations with a participation rate greater than 90% are not considered.
The percentage comparison from the previous period is shown.
Spend Lift
The net percentage increase in the average per-check spends total for loyalty-based transactions vs. anonymous (non-loyalty) transactions.
As determined by the following formula:
((average loyalty receipt amount-average anonymous receipt amount))/(average anonymous receipt amount) x 100
Note: To ensure outliers don't skew the data, individual locations with monetary lift less than -30% and greater than 90% will not be included in aggregated values.
Loyalty Transactions
The total number of loyalty receipts generated by unique loyalty users during the time period.
The percentage comparison from the previous period is shown. This metric is calculated using the event of checkin.
Online Loyalty Transactions
The total loyalty transactions made through the Online Ordering channel. This can be either from the Online Ordering Website or using the mobile app to place an online order. Checkins with integrated Online Ordering providers will occur automatically.
The percentage comparison from the previous period is shown. This metric is calculated using the event of checkin.
Loyalty Average Check Size
Net average spending per loyalty transaction, based on the Receipt or Earnable Amount.
The percentage comparison from the previous period is shown. This metric is calculated using the event of checkin.
Online Average Check Size
Net average spending per loyalty transaction made through the Online Order channel, based on the Receipt or Earnable amount.
The percentage comparison from the previous period is shown. This metric is calculated using the event of checkin.
Visualization - Loyalty Transactions
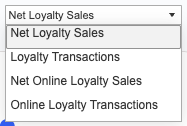
You can select any of the available options in the metrics drop-down menu to generate trends visualizations in calendar/heatmap, by hour of day, and day of week.
This dropdown applies only to the visualization charts below.
Heatmap/Line Chart
Displays the calendar view of the metric that is selected from the Select Metrics dropdown menu in the selected duration.
The day(s) with the highest value are marked with a high-intensity color and vice versa.
You can toggle between the Heat map and the Line Chart by using the menu bar at the top of the visual. By default, the heatmap is selected on the menu bar.
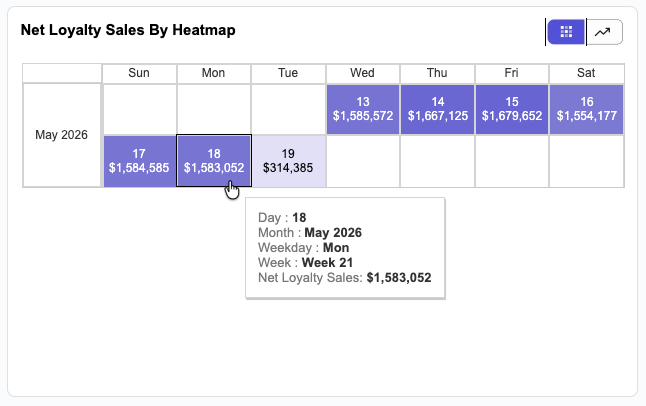
This metric is calculated using the event of the actual transaction and is based on the local time zone.
By Hours/By Week
Display the daily trend of the metric that is selected from themetrics dropdown menu in the specified duration.
You can toggle between By Hours or By Week by using the menu bar at the top of the visual.
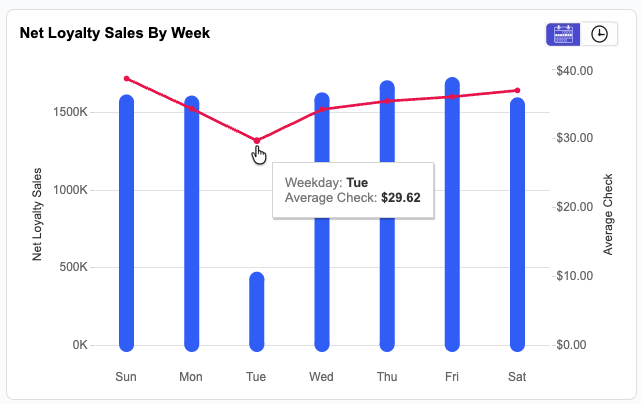
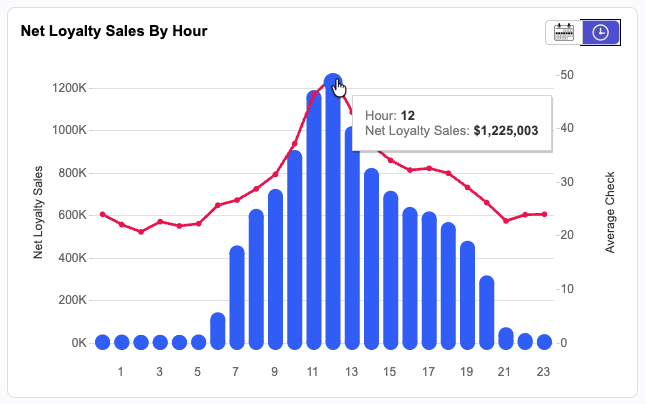
This metric is calculated using the event of the actual transaction and is based on the local time zone.
High-Level Key Metrics - Redemptions
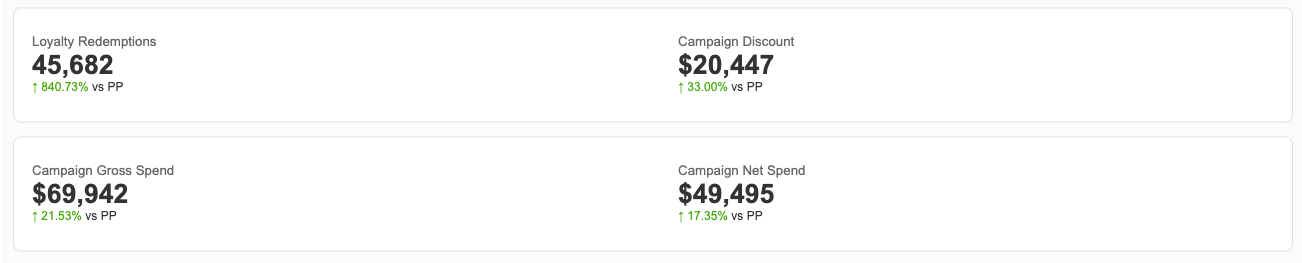
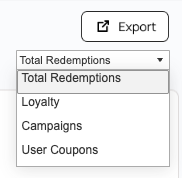
Click the metrics drop-down to select the source of the redemptions i.e. All Redemptions, Loyalty, Campaign, and User Coupon (which are also the available options in the drop-down).
This dropdown applies to the KPIs as well as to the visualization charts.
Loyalty Redemptions
The total number of offers redeemed by guests either using redemption codes or through direct application of discounts from their account, for a given business across their locations over a period of time. It includes offers given through Loyalty, Campaigns, Coupons, and Feedback-related offer giftings. Here is an explanation of each redemption source:
- All Redemptions - All Redemptions is the number of successful redemptions made in the selected duration, irrespective of the above-mentioned origins of the offer.
- Loyalty - Redemptions of offers that originated from the completion of a loyalty goal (e.g., earning 100 points resulting in a loyalty offer of a free drink). This can include redeemable or banked rewards.
- Campaign - Redemptions of offers that originated from the gifting through Campaigns. includes gift-bearing campaigns comprising of mass gifting, post checkin, and ongoing campaigns among others.
- User Coupons - Redemptions of offers that originated from the Amount or Percentage related Promos/Coupons. Note that if a redemption is based on an item-based offer that is awarded through a Promo/Coupon campaign, it is counted under Campaign Redemptions.
The percentage comparison from the previous period is shown.
Campaign Discount
The total amount (value) of discounts recorded on receipts on which a redemption was processed.
The source of the discount depends on the metric selected from the dropdown.
The percentage comparison from the previous period is shown.
Campaign Gross Spend
Gross Spend represents the total sales generated from the receipts where redemption was processed in a selected location(s) during the time range.
The source of the Gross Spend depends on the metric selected from the dropdown.
The percentage comparison from the previous period is shown.
Campaign Net Spend
Net Spend represents the total sales generated from the receipts where redemption was processed sans the value of discount on these receipts in a selected location(s) during the time range.
The source of the Net Spend depends on the metric selected from the dropdown.
Net Spend=Gross Spend-Discount
The percentage comparison from the previous period is shown.
Online Ordering Metrics
You may not see the following metrics, depending on your brand's configuration.
Online Redemptions
Online Redemptions are the redemptions that a loyalty user made through the Online Order channel at the selected location(s) during the time range.
The source of the online redemption depends on the metric selected from the dropdown.
The percentage comparison from the previous period is shown.
Online Redemptions Discount
The Total number of redemptions that a loyalty user made through the Online Order channel at the selected location(s) during the time range.
The source of the online redemption discount depends on the metric selected from the dropdown.
The percentage comparison from the previous period is shown.
Online Gross Spend
The Total sales on receipts where redemption was done through the Online Order channel at the selected location(s) during the time range.
The source of the online redemption gross spend depends on the metric selected from the dropdown.
The percentage comparison from the previous period is shown.
Online Net Spend
The Total sales on receipts where redemption was done through the Online Order channel at the selected location(s) during the time range, sans the respective discounts.
Online Net Spend=Online Gross Spend-Online Discount
The percentage comparison from the previous period is shown.
Visualization - Redemptions
Heatmap/Line Chart
Displays the calendar trend of the metric selected from themetrics drop-down menu in the selected duration.
The day(s) with the highest value are marked with a high-intensity color and vice versa.
You can toggle between the Heat map and Line Chart by using the menu bar at the top of the visual. By default, heatmap is selected on the menu bar.
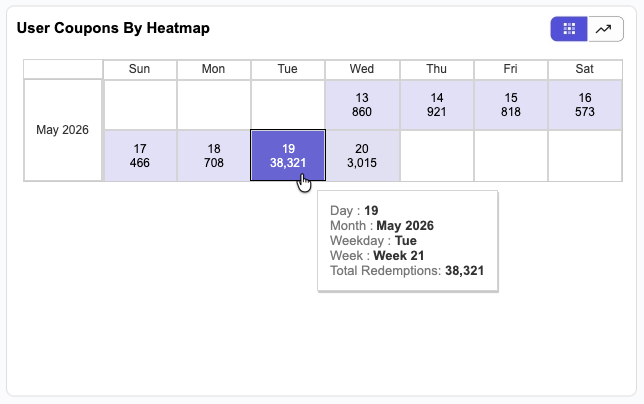
This metric is calculated using the event of the actual transaction and is based on the local time zone.
By Hours/By Week
Display the trend of the metric that is selected from the metrics drop-down menu in the selected duration.
You can toggle between By Hours or By Week by using the menu bar at the top of the visual.
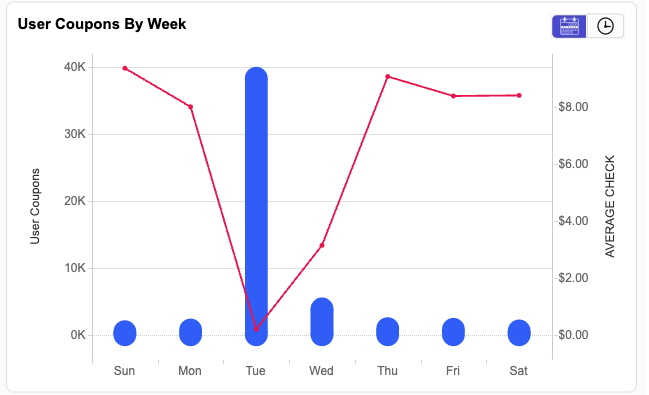
This metric is calculated using the event of the actual transaction and is based on the local time zone.