Data Pipeline - Overview
Added Module: Data Pipeline is available for an additional cost. Contact your Punchh representative to learn more about Data Pipeline and how you can start a 14-day trial.
Data Pipeline is a Punchh data-sharing product designed to provide an ongoing feed of data from Punchh to your business, for incorporation into your Data Lake and/or Data Warehouse environment as part of a broader analytics/BI strategy.
The pipeline will deliver a standard set of ETL-ready data files to your business's cloud storage locations (AWS, Azure, and GCP) every few minutes to an hour end to end, in JSON or Parquet format. The files include all data from frequently used/popular tables on the Punchh database.
The following permissions need to be enabled (Administration > All Users, Roles and Permissions > Roles)to view and edit the Data Pipeline.
- Data Sharing Admin: This permission allows edit access to configure, manage, and monitor data pipelines. This role is intended for Admins or power users.
- Data Analyst: This permission is read-only. Personnel with this permission will be able to view pipeline config and monitor the status at all times.
Create Your Data Pipeline
To create and activate your pipeline
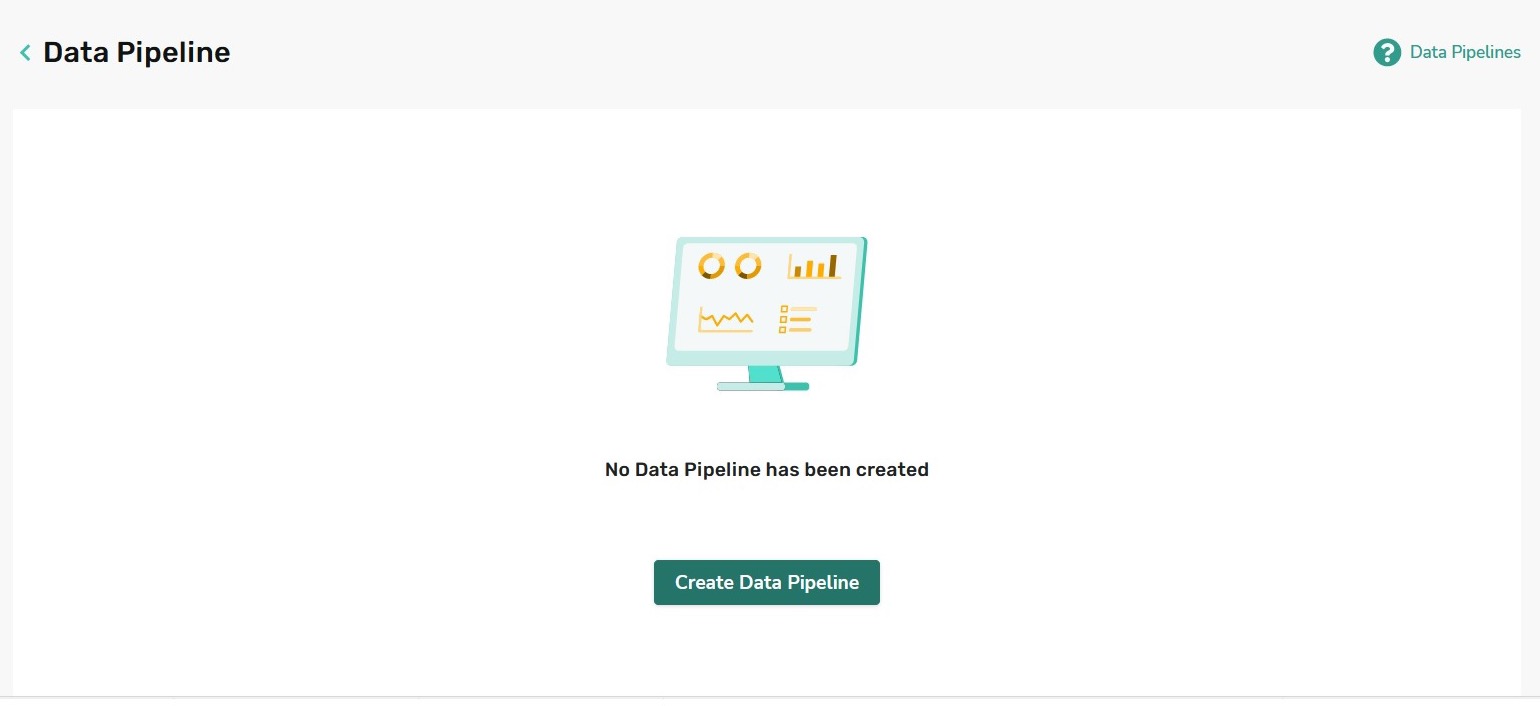
- Navigate to Data Sharing > Data Pipeline.
- Click Create Date Pipeline in the top right corner.
-
Enter the following information:
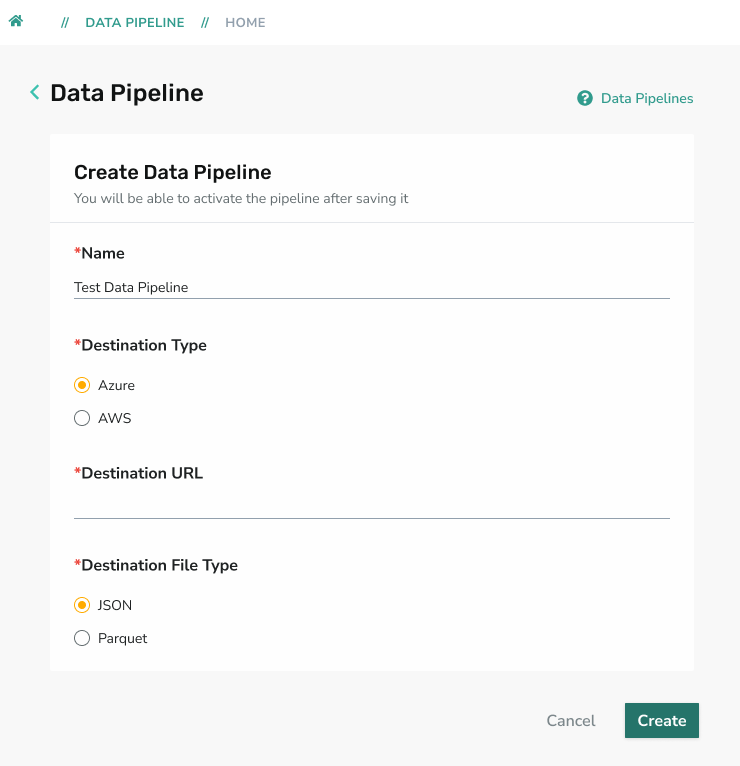
For AWS and Azure:
- Name: Enter the name of your pipeline
- Destination: Select AWS or Azure as your pipeline destination.
- Destination URL: Enter the secure link to your cloud storage location/ staging area.
- Destination File Type: Select which format you wish to receive the data, JSON or Parquet.
- Click Create.
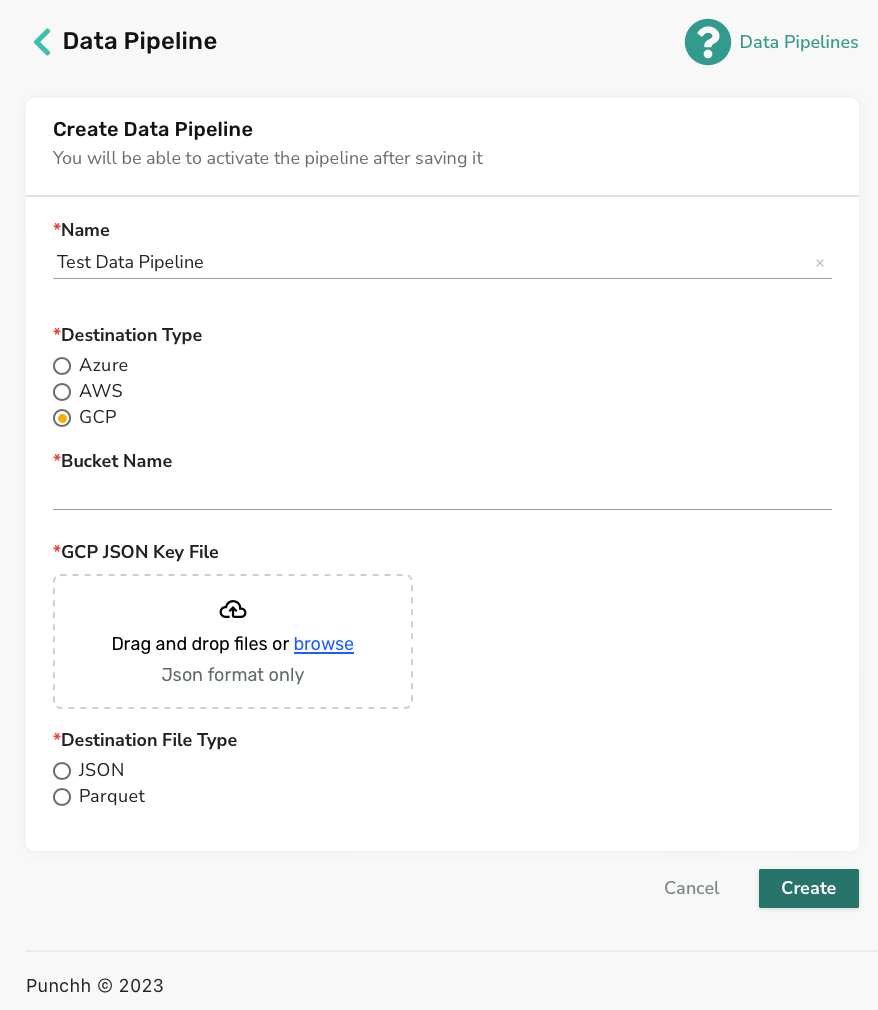
For GCP:
- Name: Enter the name of your pipeline
- Destination: Select GCP as your pipeline destination
- Bucket Name: Enter the storage bucket name
- GCP JSON Key File: Upload the JSON file that contains the private key
- Destination File Type: Select which format you wish to receive the data, JSON or Parquet.
- Click Create.
-
Your pipeline is now available as a Draft to review on the Pipeline Dashboard. Changes can continue to be made in the Draft status. Once a pipeline begins activating, the parameters will be locked.
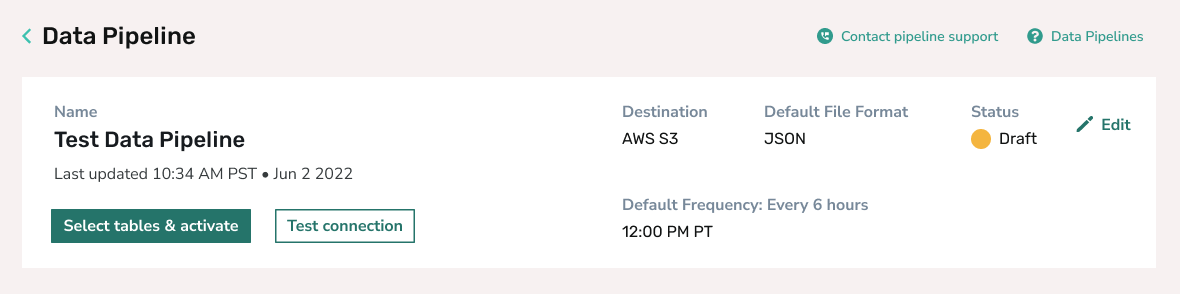
- When in Draft status:
- Click on Test Connection to test connectivity to the cloud staging area using the destination URL. A successful connection validates the destination URL and ensures data delivery to the right location. Invalid URL will result in an error
- Adjust the day and start times of data transfer as needed. Select a time of the day for ‘Every 6 hours’ and ‘Daily’ frequencies or select both day of the week and time of day for ‘Weekly’ frequency. The selected ‘time of day’ (and ‘day of week’) in the admin timezone will be displayed on the screen. If no values are selected, default values (time of day - 00:00 hours, UTC time zone, and day of the week - Sunday) will be displayed.
- Once you are ready, click "Select tables & activate" to begin activating your pipeline. The next set of screens will allow you to pick and choose tables on Punchh database that need to be delivered via the pipeline.

Table Selection
The next screen will present tables, formats, and frequency selection options.
-
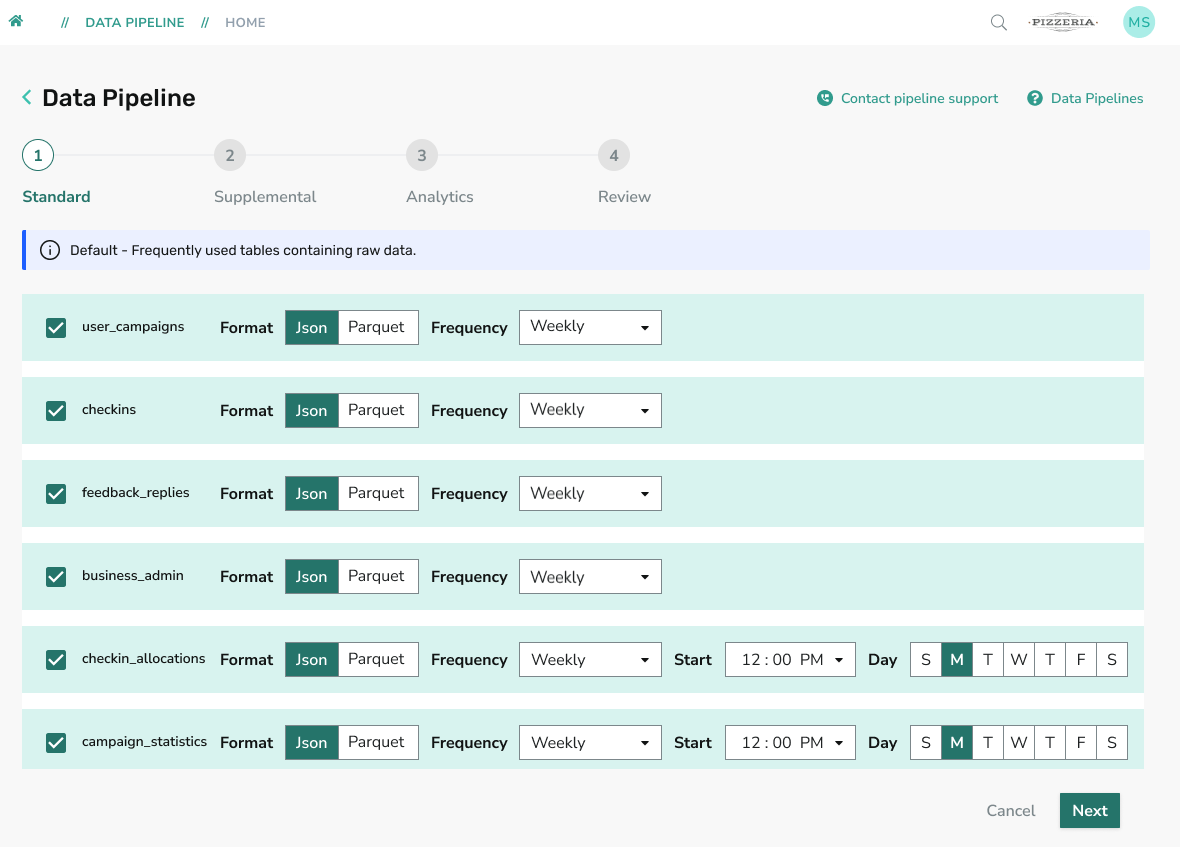
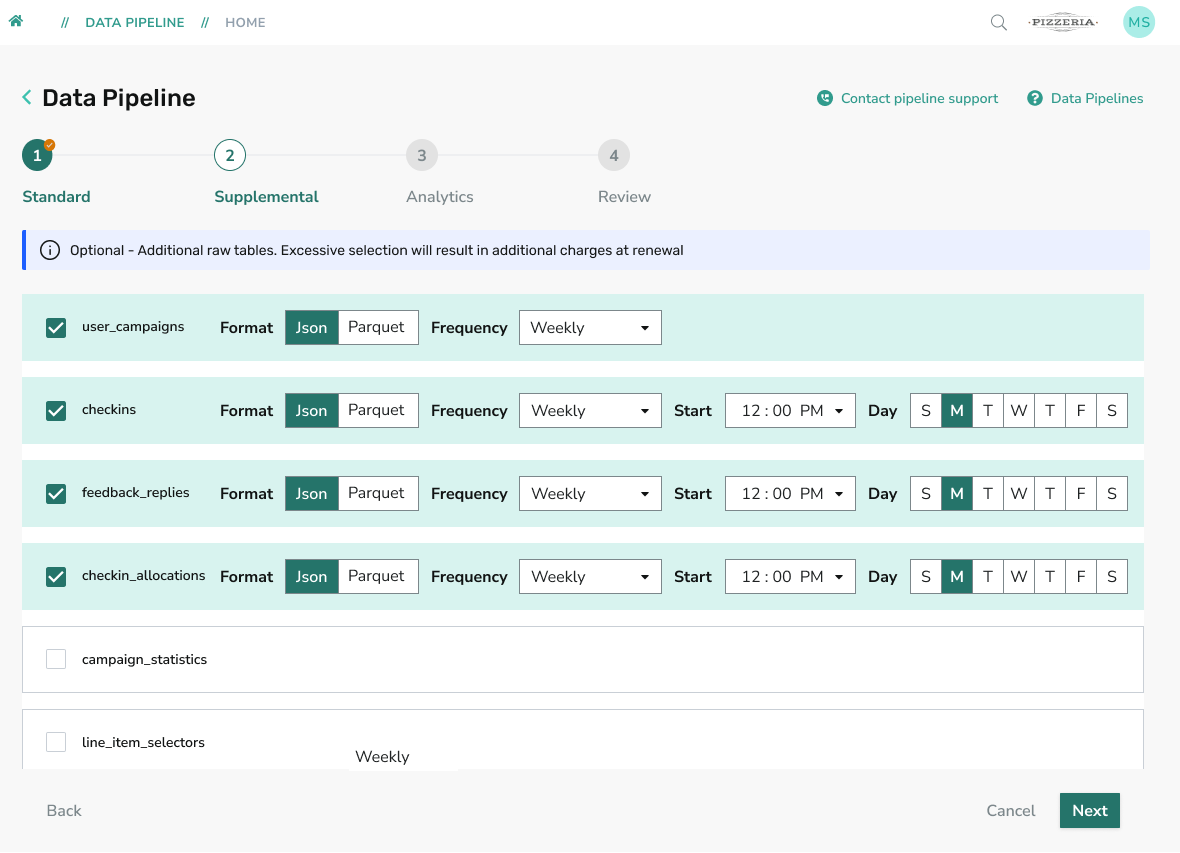
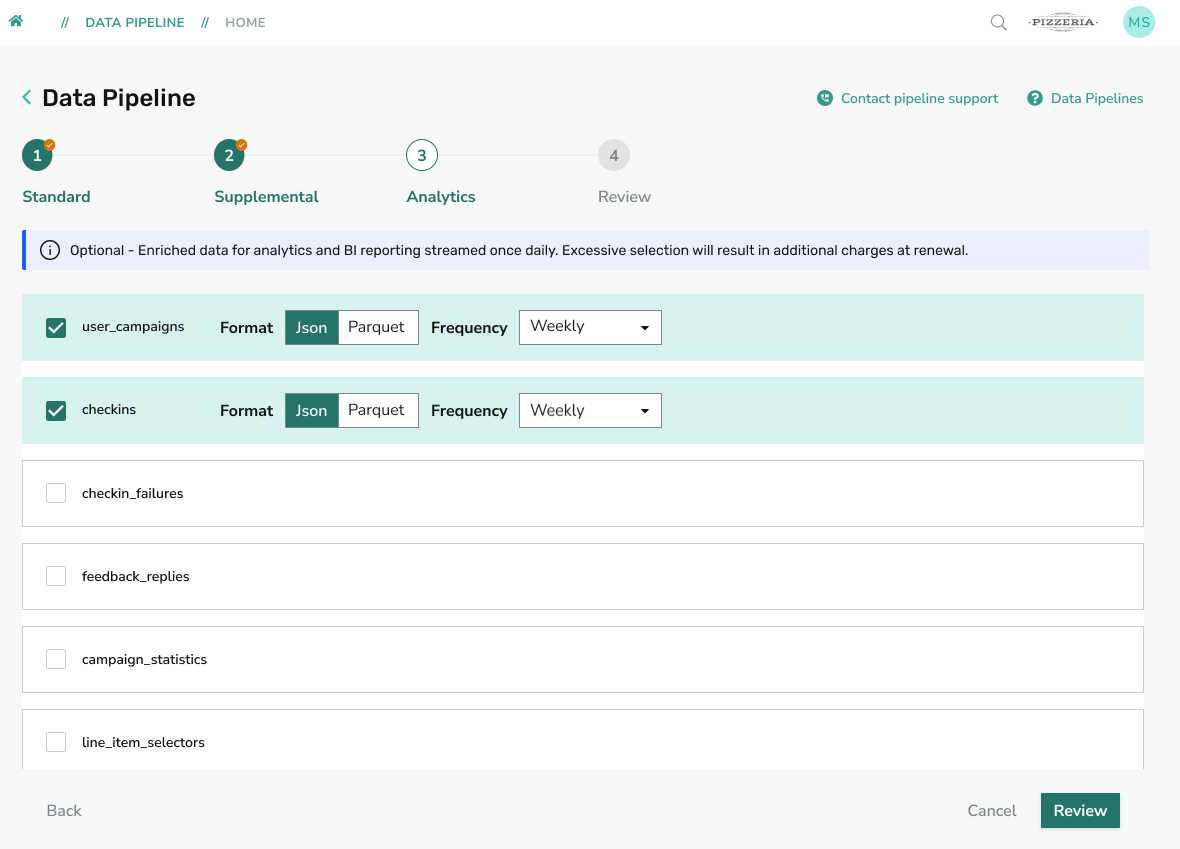
Select tables from one or all of the categories below by checking the box to the left of each table. Click ‘Next’ or ‘’Back’ to navigate between the categories.
- Standard will include ‘default’ set of 46 frequently used tables containing raw (ETL ready).
- Supplemental will include optional tables (sizes medium to large) containing raw (ETL ready) data.
- Analytics category will include optional tables containing enriched (analytics ready) data that will be streamed once a day only due to heavy processing volume and costs.
- Standard will include ‘default’ set of 46 frequently used tables containing raw (ETL ready).
-
Select the preferred format - JSON or Parquet, for each of the tables selected above. The initial value will be defaulted from the configuration.
-
Select the preferred frequency for each of the tables selected above. The frequency options will include ‘Every Six hours’, ‘Daily’, and ‘Weekly’ options.
- The options presented will be default (highest) frequency selected on the configuration page and all the lower frequencies that follow. For eg, if the default frequency is ‘Every Six hours’, the options available to choose will be ‘Every Six hours’, ‘Daily’, ‘Weekly’.
- All tables in ‘Analytics’ category will be stream ‘Daily’ or ‘Once a day’ only. No overrides allowed.
- Changes to ‘Default Frequency’ on the Monitoring Dashboard will override the table level selections made above.
Warning: Exercise caution during table selection. Excessive selection of tables from Supplemental and Analytics category will increase the processing volume and result in additional charges at renewal.
- Once the selections are complete, click ‘Review’ to review your selection. You may go back and modify selections on each of the category by clicking on the ‘Revisit’ button.
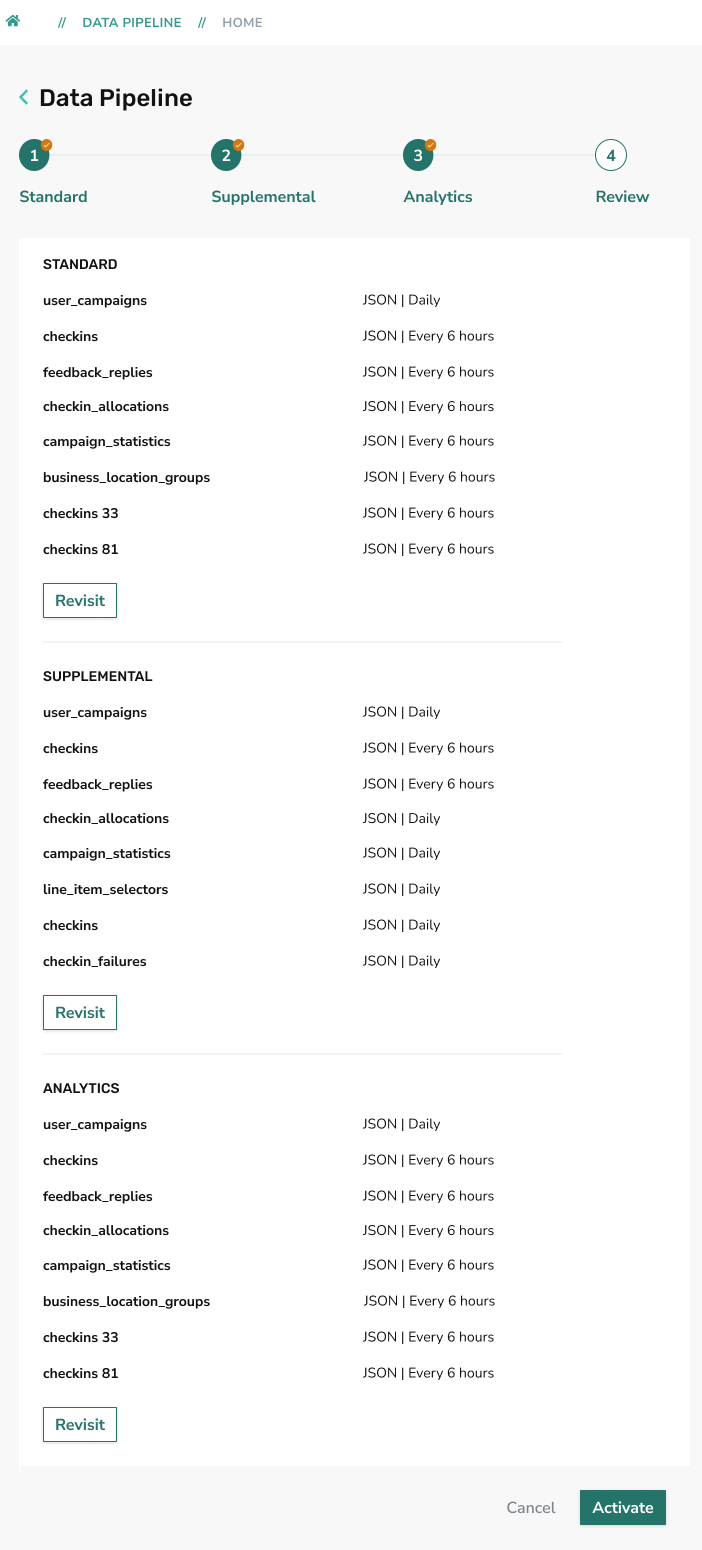
After review, click Activate to begin activating your pipeline.
Data Pipeline Status
Your pipeline can be in one of the following states:
| Draft | Initial (and only) state where config can be modified, connectivity to cloud staging area can be tested and activation can be requested |
|---|---|
| Activating | Intermediate state when the activation is in progress. Steps include resource initialization, historical data load and switch to change data control (CDC) or continuous streaming mode. Note: This status may persist for a while as historical load times vary. |
| Active | In this state, pipeline infrastructure is up and running, delta data streaming is in progress and monitoring is available (includes pipeline status, table delivery stats, and metrics, alerts, and notifications) |
| Inactive | Pipeline is deactivated, and data is no longer streaming. Needs manual intervention to 'Reactivate or restore' the pipeline. The config can be modified upon 'Re-activation'. Last known status and metrics available |
Manage Data Pipeline
If you wish to modify your pipeline configuration, pause, or stop data transfer, you need to deactivate your pipeline by clicking on Deactivate. This changes the pipeline status to Inactive.
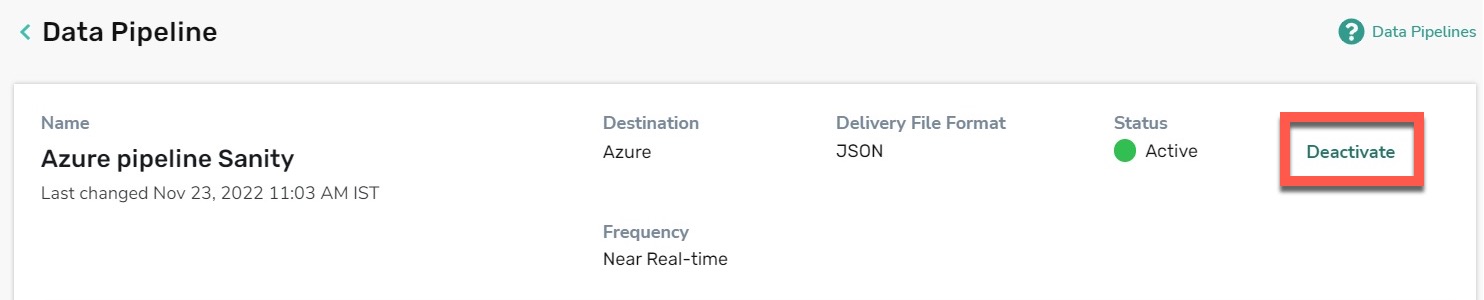
In order to modify the data (tables) streamed via an Active pipeline, you need to click the 'Modify Table Selection' button.

Revisit the section 'Table Selection' to guide you through modifying the tables.
- Once the selections are complete, click ‘Review and Activate’ to review your selection. You may go back and modify selections on each of the category by clicking on the ‘Revisit’ button.
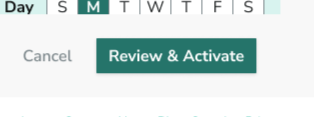
- If there are NO changes, click on the ‘Continue’ to confirm. After review, click Activate to begin activating your pipeline.
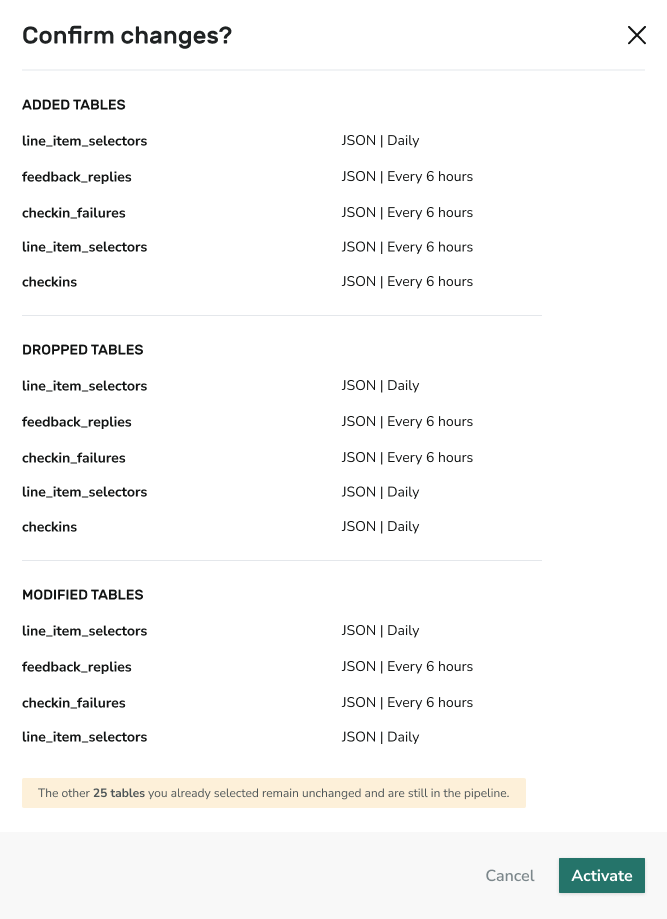
Contact Punchh Data Team to request the re-activation of your pipeline. Once they restore the pipeline, you may activate your pipeline to resume the data transfer. Please contact the Punchh Data team <data-pipeline-support@partech.com> for historical data load requests and other inquiries.
Alerts and Notifications
The system will send out periodic alerts and notifications as a part of various workflows. The banner message will be displayed on the screen to notify users of workflow statuses. Success messages will be in green. Error messages will be red. In addition to the banner, email communication will be sent out for all error scenarios.
Click
 to add specific email addresses to subscribe to your data pipeline alerts and notifications and stay informed of Punchh pipeline status at all times.
Test Connection
In addition to the banner, an email communication will be sent out for the following error scenarios:
- Destination URL not accessible
- Host Destination not responding
- General System Errors / Other errors
Once the errors are resolved, your admins will be notified again so you can attempt to test the connection again.
Activation
During all phases of activation, a banner message will be displayed on the screen - green for success and red for error scenarios. In addition to the banner, email communication will be sent out notifying customers of the error
- Host/Destination URL is in error or not responding
- All other scenarios resulting in a ‘General System’ error
Monitor Data Pipeline
Once your pipeline is activated, the Pipeline Dashboard displays the pipeline configuration, health/status along with availability and completeness metrics at all times. The Punchh team will send periodic notifications and alerts so you can stay informed about pipeline latency issues and/or other events that could potentially delay, pause, or stop data transfer until the issue has been resolved. While some messages are informational, others may have a 'call to action'.
The following stats around data pipeline are available at all times:
- Total number of tables transferred along with a link to data dictionary to help with data discovery. Use the search option at the top to look for specific table information.
- Number of tables that encountered errors during transfer (if any).
- Most recent delivery date timestamp (in customer admin timezone) at pipeline level.
Availability and Completeness Metrics at the table level are explained below:
- Name: Table name
- Schema Modified: Table definition was last changed on this date
- Format: Data delivery format
- Frequency: Data delivery cadence
- Latency: Data transfer delay from source to destination
- Last Delivery: Data was last delivered to the destination at this date-time
- Today' Count: Number of rows of data delivered to the destination today
- Yesterday's Count: Number of rows of data delivered to the destination as of the previous day
- Status: Status of delivery based on the most recent delivery attempt
Data Dictionary
Pipeline standard set includes data from approximately 46 of the most valuable tables in the Punchh
database, including guest profiles, check-ins, redemptions, reward data, and campaign participation. You may be receiving additional tables based on your needs and/or contract.
Pipeline delivers individual files containing data from one Punchh table each for an interval of time, typically 15 minutes to less than one hour. Each file includes insert, update, and delete events from one Punchh table for that interval of time
Maximize the use of pipeline data with Punchh Data Dictionary - a one-stop shop to discover data, locate columns, and understand metadata/nomenclature, entity relationships, and data models.
Note: New/additional requests may incur additional charges and require SOW changes.