Target Food Variance Report
The Target Item Use vs Actual Item Use (MU) report helps you review and research item usage. It compares an item's Actual usage (what came out of inventory based on counts) to Target usage (what should have been used based on PLU sales of the item and recipes using the item) and also shows Waste. It links to COGS and Item/Recipe Utilization reports for you to see addition details.
The Target item Use vs Actual Item Use (MU) report is also often referred to as the Target Food Variance (MU) report.
Parameters
-
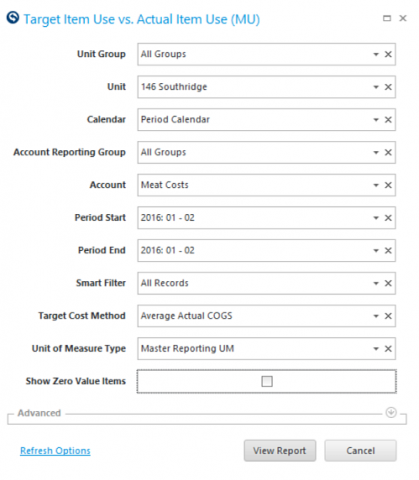
Unit Group: Select Unit Group to view.
-
Unit: Select Unit to view.
-
Calendar: Select the calendar to use.
-
Account Reporting Groups: Select the Account Reporting Group to view.
-
Account: Select the account to view.
-
Period Start: Select the period you wish to view.
-
Period End: Select the period through wish you wish to view.
-
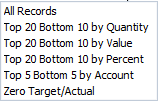
Smart Filter: The default is ‘All Records’. The other options available are a list of outlier choices:
-
Target Cost Method: Select either Average Actual COGS to view cost as COGS/Sold Qty, or select Average Inventory Cost to view the cost as the beginning Inventory Cost.
-
Unit Of Measure Type: Select either Master Reporting UM, Unit Reporting UM or Costing UM as the roll up measure to report.
-
Show Zero Value Items: Put a check in this box to review items with zero variance.
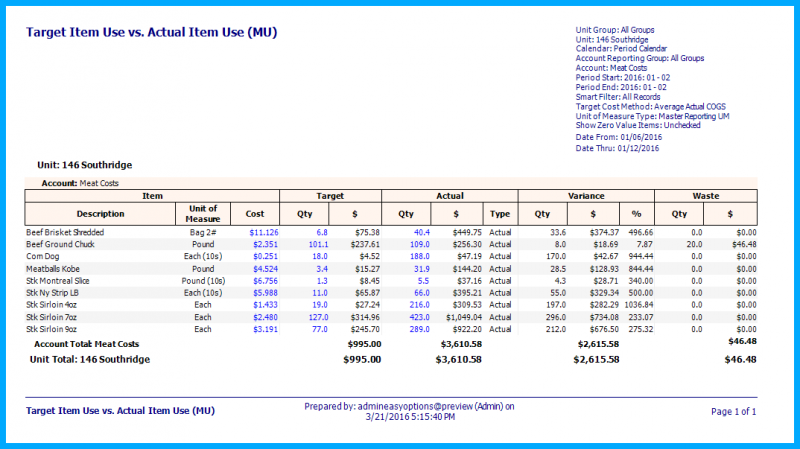
This report shows the following:
- Cost: Item cost for a particular date range.
- Target: Qty and $ based on recipes and what was sold.
- Actual: Qty and $ based on inventory values.
- Variance = Actual – Target.
- Waste: Qty and $ values entered (This value does not figure into the Target values. It is merely shown to help you explain variances)
When Average Actual COGS is selected, there is always a chance that you will see a negative cost of goods. These could be caused by many factors - a recipe change, a count mistake, or an invoice costing mistake. In such a case the target cost we use (COGS / Sold Count) will generate unusual but accounting/mathematically correct values. These may seem strange to an operator so the alternate option of Average Inventory Cost which uses the beginning Inventory Cost for sub-period may be a better option.
Drill-Down To Linked Reports
Some columns in this report drill down into other reports.
- Cost: Cost of Goods
- Target: Item/Recipe Utilization
- Actual: Cost of Goods
Cost Of Goods
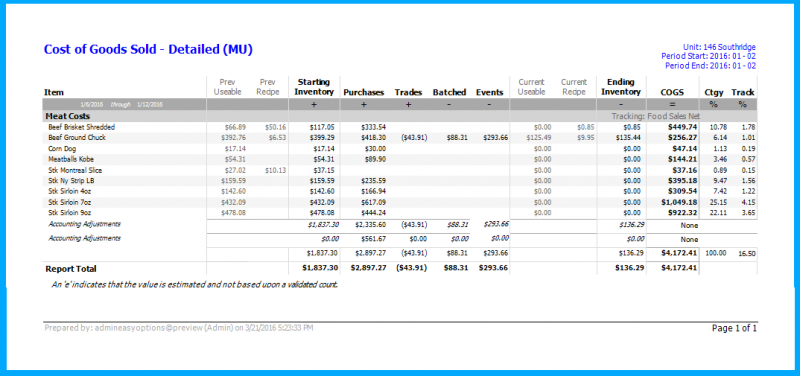
Clicking on the Item Cost or Actual Qty columns in the Target Item Use vs Actual Item Use (MU) report will run the Cost of Goods report for the item clicked for the same time period. It will show information for the entire account for the item you have selected.
This report can help you to see the cost of the item as well as the beginning and ending count values and purchases for that time frame. By viewing this report, if there is an issue with one of these values, it will help steer you to the area that needs to be corrected. If the issue is with the purchases, then perhaps an invoice has been entered incorrectly. If the issue is with cost of goods, then perhaps an invoice has been entered incorrectly or inventory counts have been entered incorrectly.
See RDC_InventoryCOGSDetails_Rpt for more detail on COGS reports.
Item/Recipe Utilization
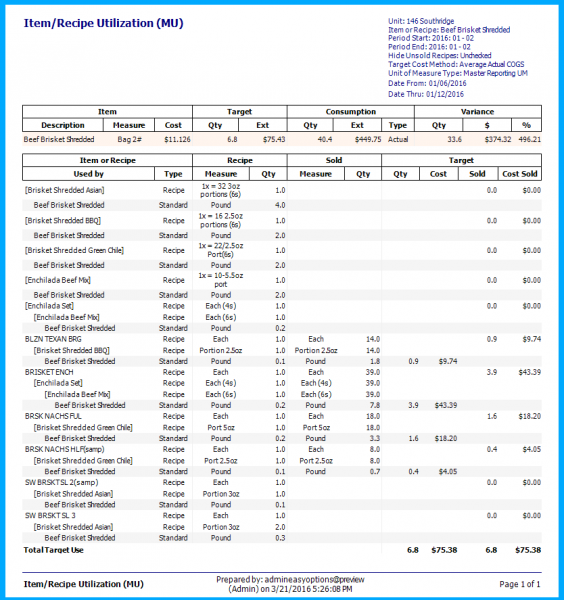
Clicking the 'TARGET QTY 'column of the Target Item Use vs Actual Item Use (MU) report report will run Item/Recipe Utilization report for the item clicked for the same time period. It will show the item and all recipes that correspond to the target value selected.
This report will show you how the target value is calculated for each recipe and how many were sold. By viewing this report, if there is an issue with one of these values, it will help steer you to the area that needs to be corrected. If the issue is with the recipe, correct the values in the Item Master form. If the value is with qty sold, correct the linking in the POS Items Linking form.
If you notice that there are recipes missing from this report, it could be for several reasons:
- Those recipes are smart grouped out of that unit.
- Those recipes are not part of that unit my purchase items list. If this is the case there are several ways to correct this
- Run the Synchronize Unit Items report.
- Recommend those recipes and run the Synchronize Unit (RDC_SyncUnit_Rpt) report.
- Log into the unit and add the purchase items to your My Purchase Items list in Purchase Items.
See RDC_ItemRecipeUtilization_Rpt for more detail on Item/Recipe Utilization reports.
See Cost Changes In A Grid
Running the Target Item Use vs. Actual Item Use report to grid can help you see cost changes over a time period.
- Select New > Grid from the Tools tab.
- Right click the column headers and select Fixed> Left for:
- Cost
- Beginning Cost
- Ending Cost
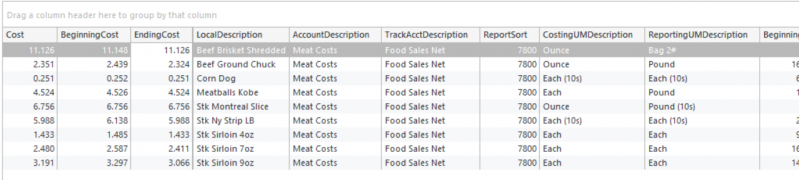
This layout helps you to see any significant cost changes to any item.