Recipe Cost By Group Menu Engineering Report
Menu Engineering (MU) is used to review and research item usage.
Parameters
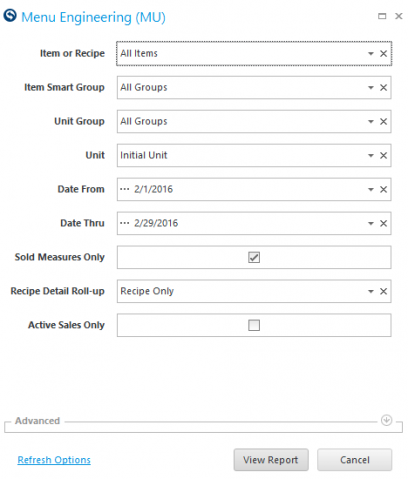
- Item Or Recipe: Select the Item or Recipe to view. The item/recipe must have at least one sold measure.
- Item Smart Group: Select the item group.
- Unit Group: Select Unit Group to view.
- Unit: Select Unit to view.
- Date From: Select Start Date to view from.
- Date Thru: Select End Date to view through.
- Sold Measures Only: A check in this box will show only those items that have a measure permission of “Sell.”
- Recipe Detail Rollup:
- All Details: Shows all the recipe details.
- Sub Recipe Only: Shows only the recipe and sub recipe lines.
- Recipe Only: Shows only the recipe lines.
- Active Sales Only: A check in this box will show only those items who have sales for the date and unit parameters selected.
- Show Hidden Recipes: A check in this box shows hidden recipes.
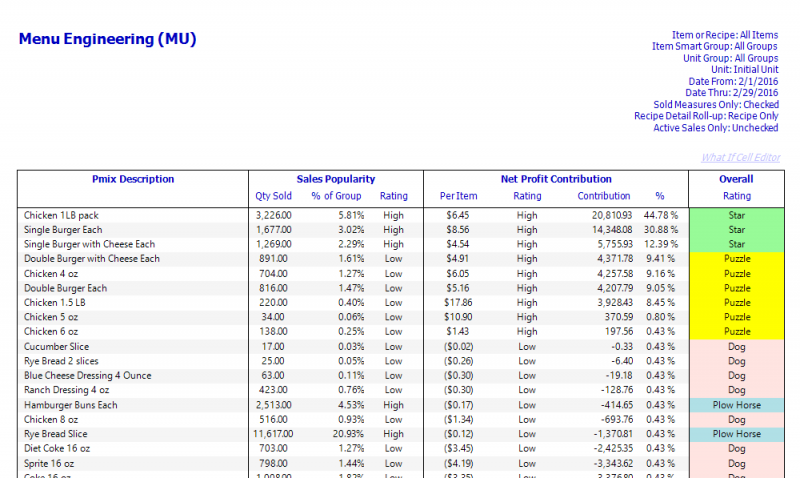
Use this report to see which recipes are most popular and those that are most profitable.
It is best to execute this report using a small and related group (smart group) of items, for example 'Deserts'; this is because you are looking for correlations of buying patterns within a menu-group offering on your menu. You may even wish to break-up large categories (like alcoholic beverages) into sub-groups like 'Beers' or 'Red Wines' for example. Although you can run all units for a large date range, you may find that a sub-set of restaurants over the past 30 days will provide a good sample on how customers are interacting with your menu offering and the effect on contribution to net profit.
Using the Star, Puzzle, Plow Horse and Dog model put forth by Dr. Michael Kasavana, University of Michigan, the report ranks each item for its popularity (the percentage of an individual items sold count divided into the total of the group sold count) and its' profitability (the items total net profit divided by sold quantity). These two measures are then compared to the group average of popularity and profitability resulting in a ranking of 'High' or 'Low' for each item and measure.
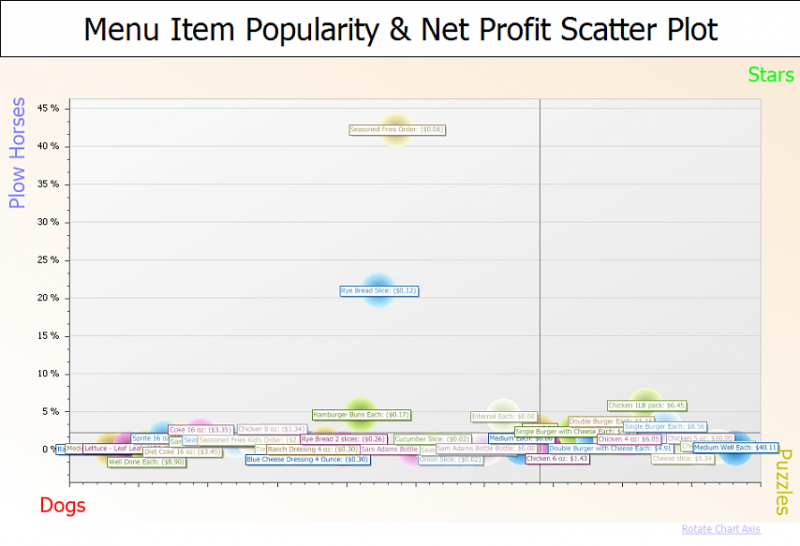
The data is then presented in both table-view and a weighted scatter plot. The plot shows the results in quadrants, those quadrants explained here (depending on how you rotate the chart axis, the Plow and Puzzle may alternate position):
- Star = High-Popularity & High-Profitability (upper-right quadrant).
- Plow Horse = High-Popularity & Low-Profitability (upper-left quadrant).
- Puzzle = Low-Popularity & High-Profitability (lower-right quadrant).
- Dog = Low-Popularity & Low-Profitability (lower-left quadrant).
There is a great deal of research and opinion on how to use this information to build a more profitable menu presentation; much of the information also includes the some psychology and science regarding how certain people read a menu and the overall layout of the menu and pricing itself. The data contained within this report is only a starting point, allowing you to see what customers like and what makes the most profit, but these two attributes do not always happen at the same time. Here are some general guidelines, all to be combined with your own common sense and experience, to build a more profitable menu offering:
- All 'N/A' items are items that have no selling counts. If these items are menu items no-longer sold, exclude them from your smart group for analysis. If they are still being sold then you need to wonder why they do not have any sales quantity.
- Plow Horses are popular but not making significant profit. Try to imagine if you can re-portion for cost savings, and/or increase the selling price. Be careful: an increase in price can reduce a plow-horse to a puzzle, or even worse a dog.
- Puzzles are not selling well, but do have good profit making potential. Are these items hard to find on your menu or not well understood by your service staff? Perhaps you can promote them by better menu presentation. Or is the margin on these items too high, and therefore not seen as a value to your customers? You can try to lower the selling price somewhat to stimulate sales. Be careful not to drive the profit so low that you end up with a plow horse, or even worse a dog.
- Dogs are not popular and not money makers. If at all possible consider removing these items from your menu. Use your judgment here, but any item that you carry that does not make you significant profits could be actually costing you money with inventory carry, extra training, the potential for waste and more.
Make frequent and small changes to your menu. Menus are expensive to print and produce, but if you make large changes, it will be hard to attribute what worked and did not work in terms of "interaction." You may find that by removing a plow horse you drive the consumer to a puzzle making it a star. But when you make lots of change, it is hard to imagine the number of interactions and correlations in your changes. You may find that more frequent menu tuning, but with very small and measurable changes will more than cover the cost of the menu engineering and menu printing costs.
All of the suggestions are only suggestions - YOU have the final say on all menu engineering, knowing your customers and your market in a manner not possible to illustrate in a report.